. 2014 Sep 12;3(10):937-46.
doi: 10.1242/bio.20148193.

Autocrine Activation of the Wnt/β-Catenin Pathway by CUX1 and GLIS1 in Breast Cancers

Affiliations

Autocrine Activation of the Wnt/β-Catenin Pathway by CUX1 and GLIS1 in Breast Cancers

Charles Vadnais et al. Biol Open. .

Abstract

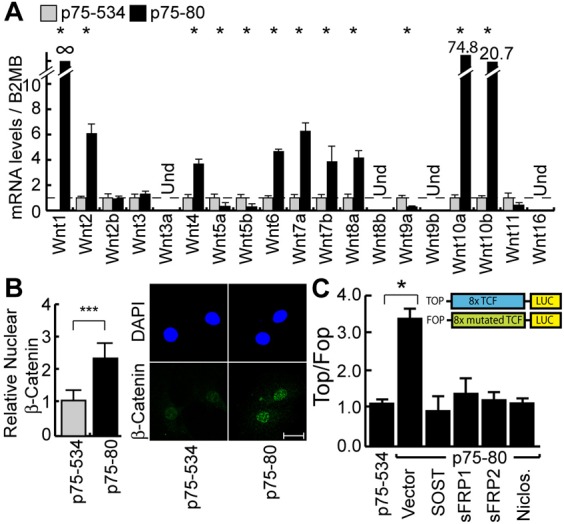
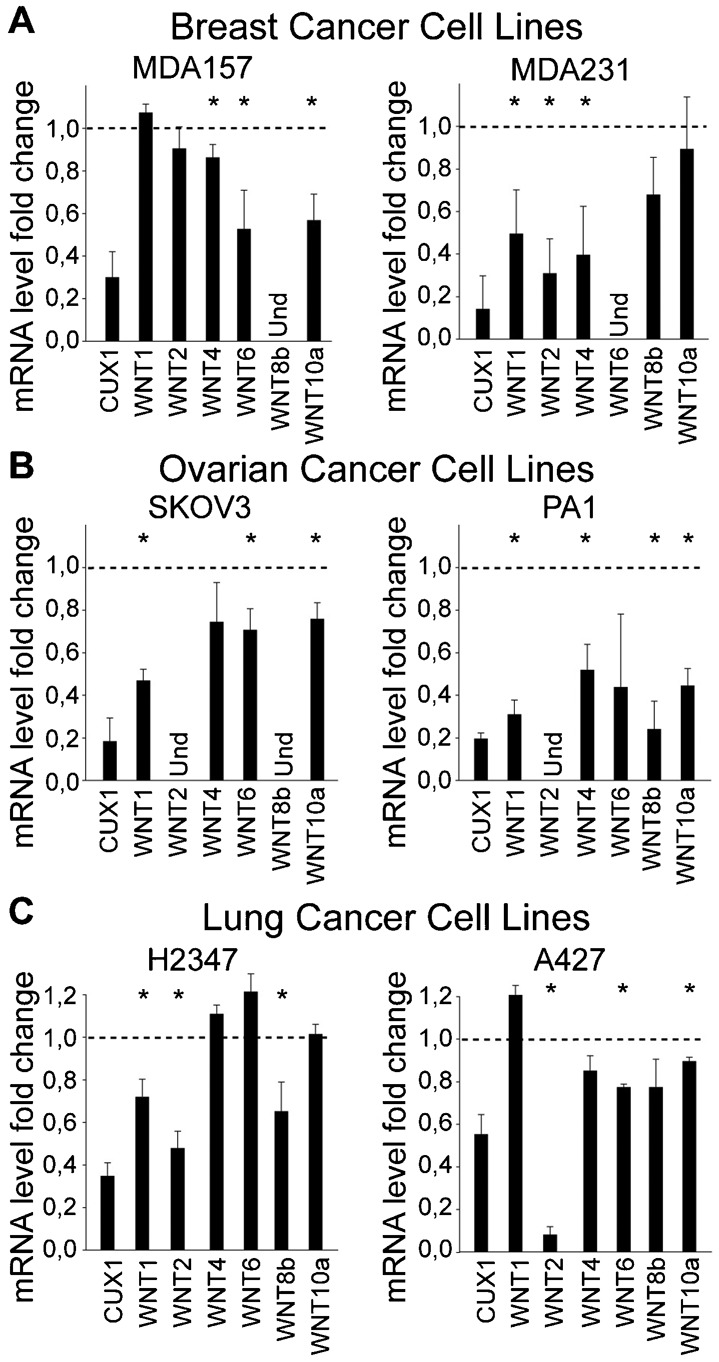
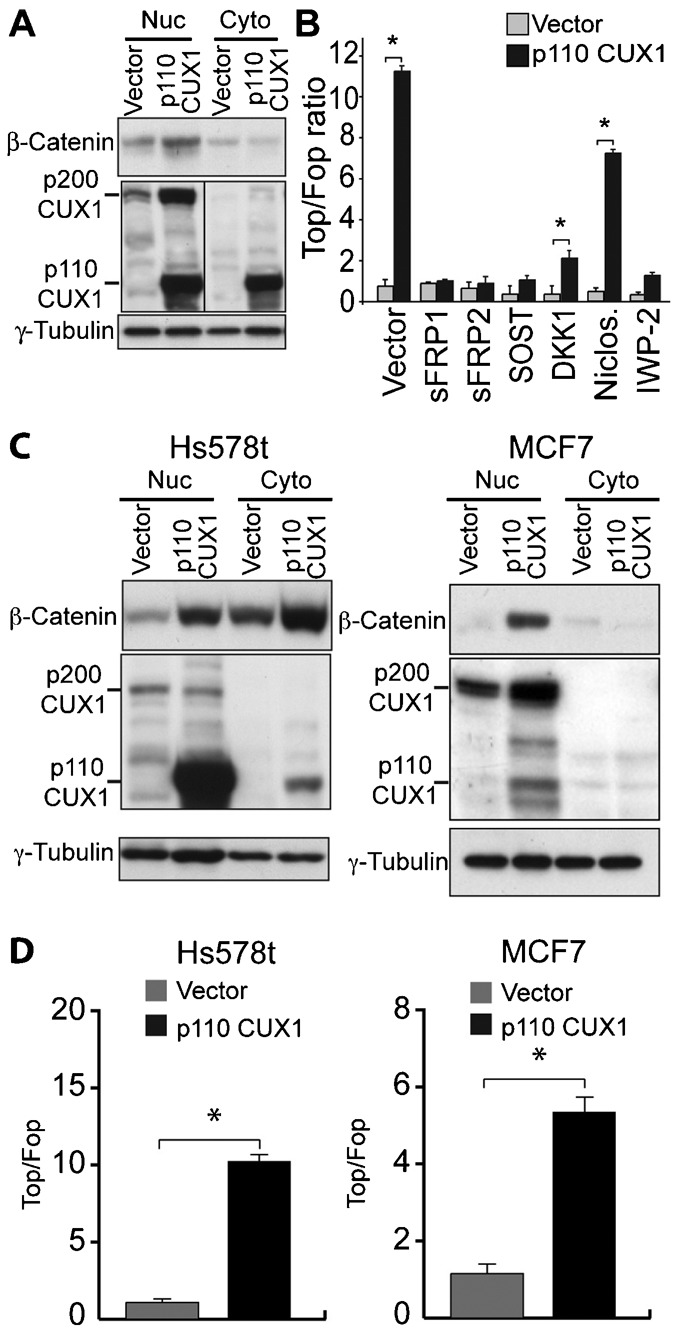
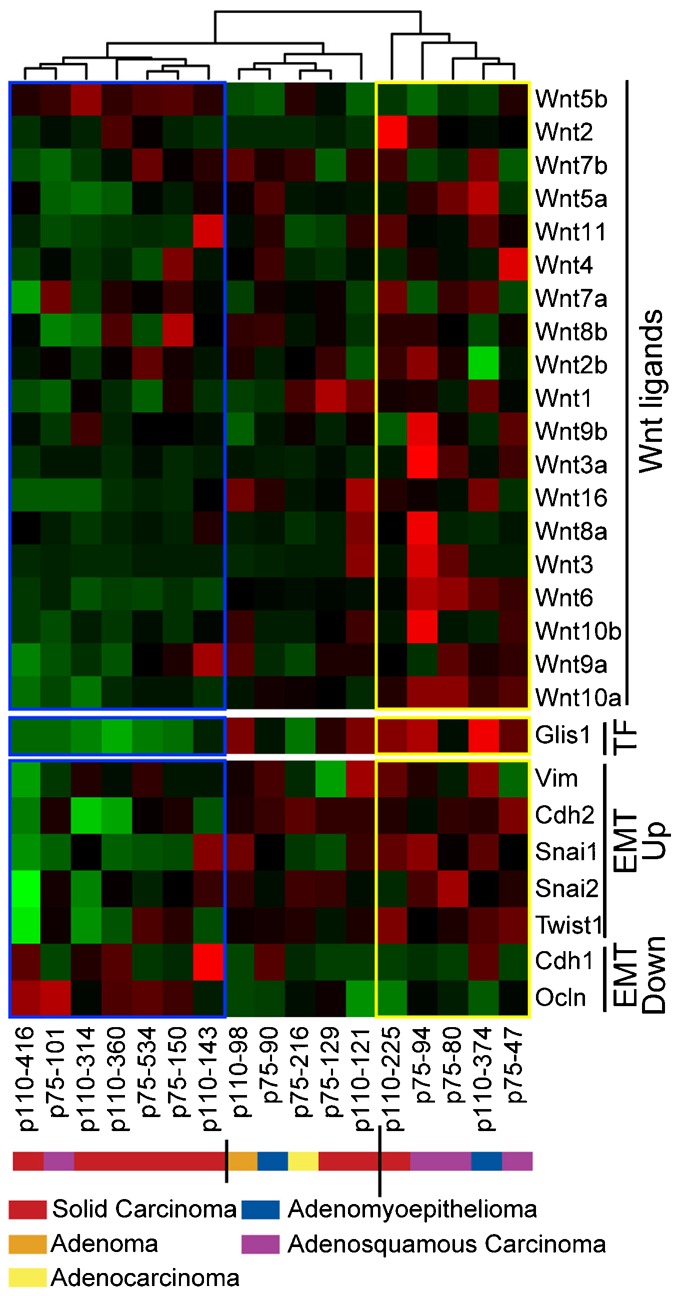
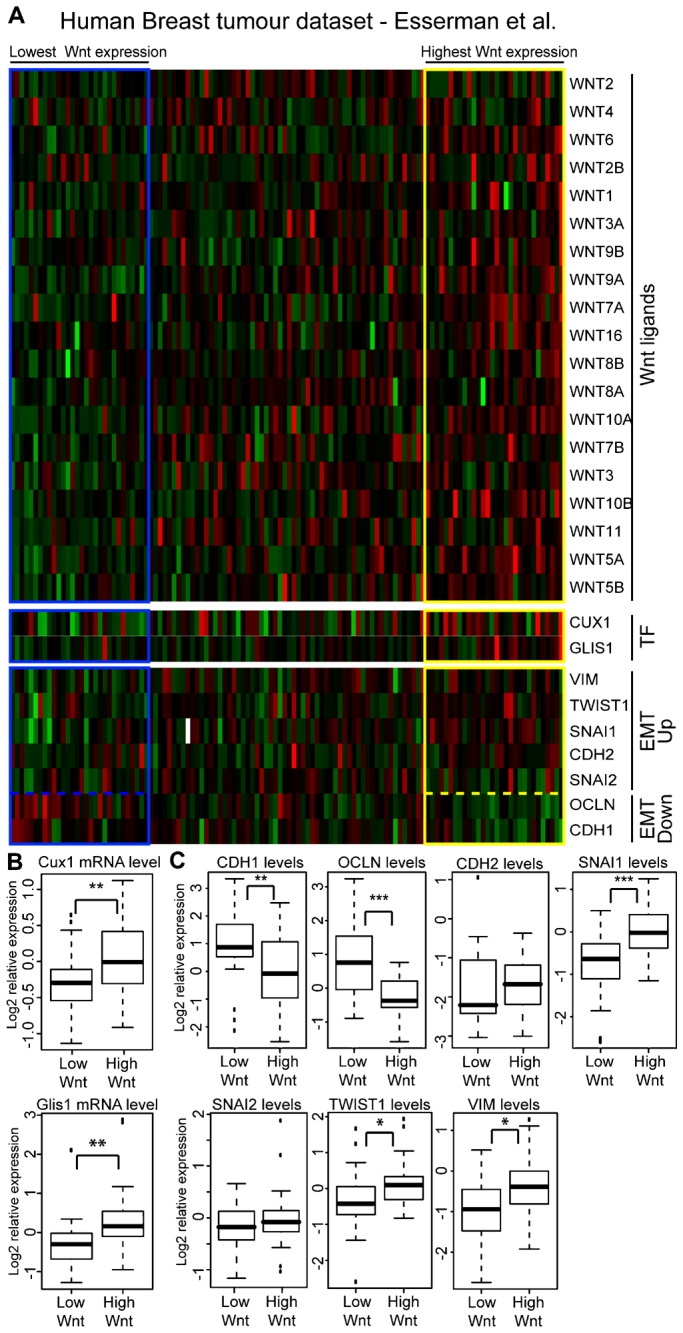
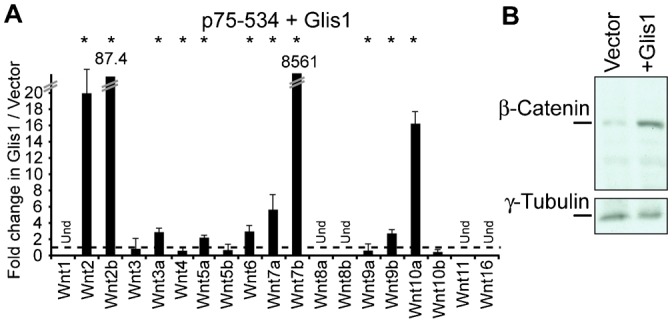
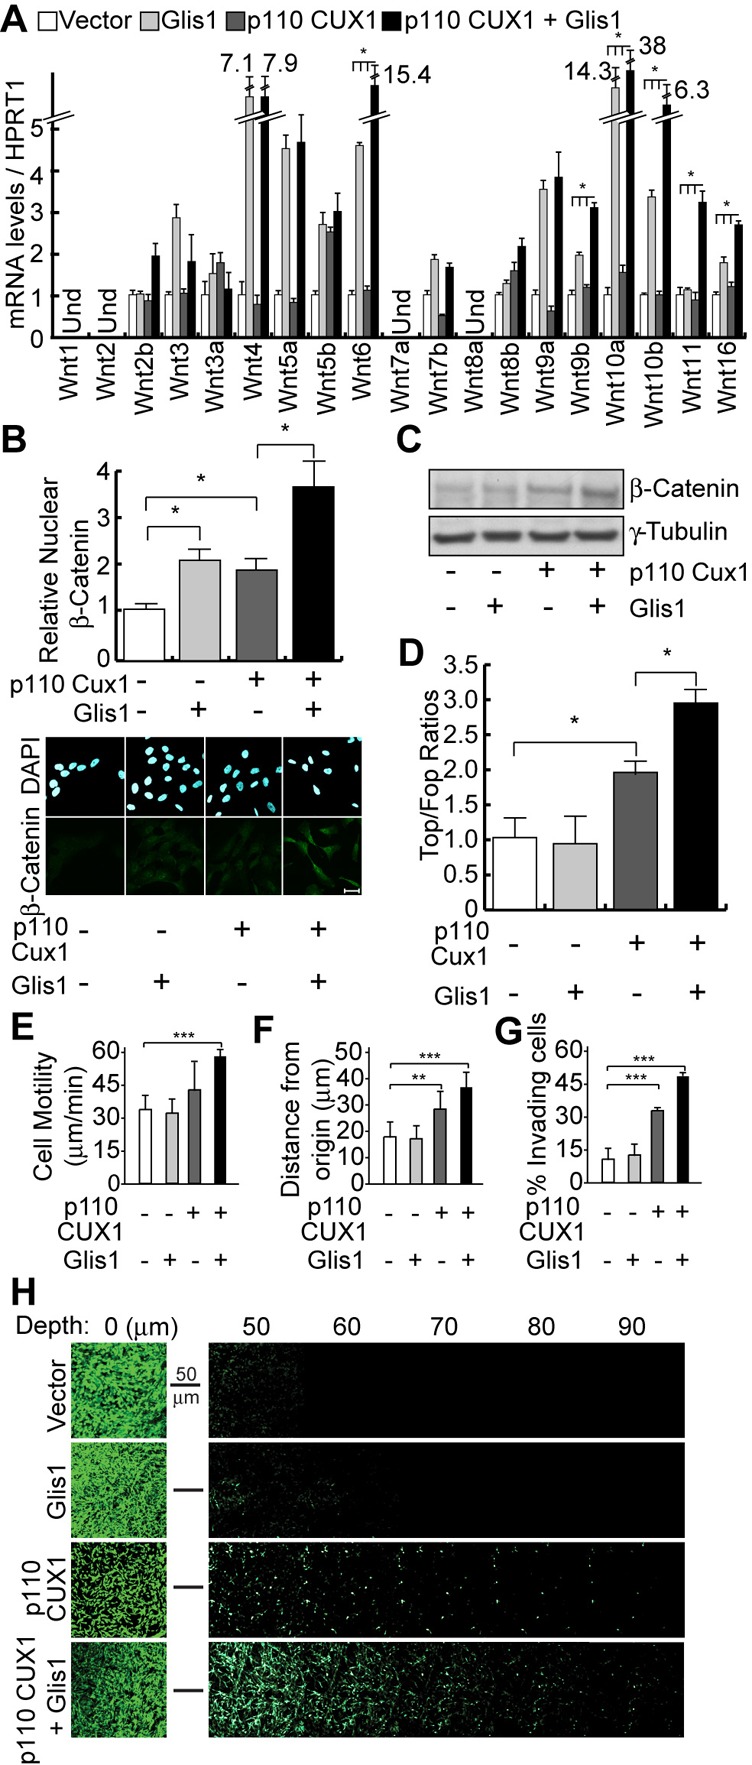
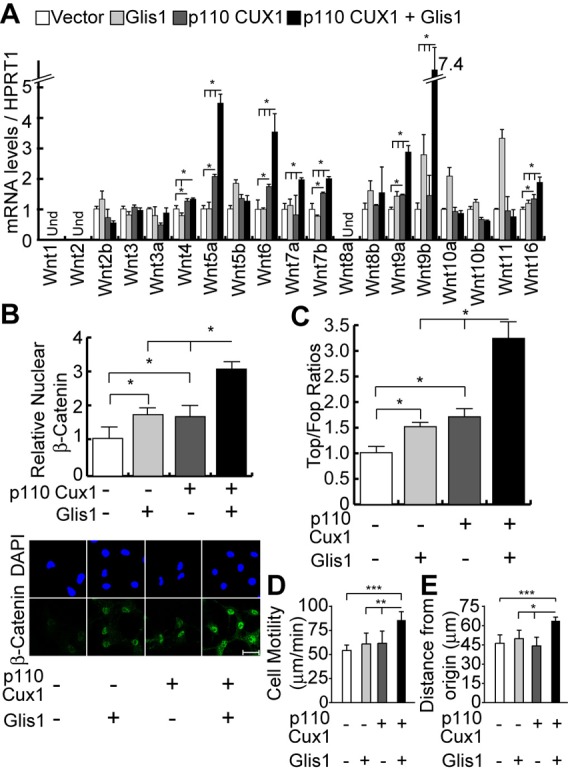
Autocrine activation of the Wnt/β-catenin pathway occurs in several cancers, notably in breast tumors, and is associated with higher expression of various Wnt ligands. Using various inhibitors of the FZD/LRP receptor complex, we demonstrate that some adenosquamous carcinomas that develop in MMTV-CUX1 transgenic mice represent a model for autocrine activation of the Wnt/β-catenin pathway. By comparing expression profiles of laser-capture microdissected mammary tumors, we identify Glis1 as a transcription factor that is highly expressed in the subset of tumors with elevated Wnt gene expression. Analysis of human cancer datasets confirms that elevated WNT gene expression is associated with high levels of CUX1 and GLIS1 and correlates with genes of the epithelial-to-mesenchymal transition (EMT) signature: VIM, SNAI1 and TWIST1 are elevated whereas CDH1 and OCLN are decreased. Co-expression experiments demonstrate that CUX1 and GLIS1 cooperate to stimulate TCF/β-catenin transcriptional activity and to enhance cell migration and invasion. Altogether, these results provide additional evidence for the role of GLIS1 in reprogramming gene expression and suggest a hierarchical model for transcriptional regulation of the Wnt/β-catenin pathway and the epithelial-to-mesenchymal transition.

Keywords: Breast cancer; Expression profiling; Mouse tumor model; Transcriptional regulation; Wnt/β-Catenin pathway.


Conflict of interest statement

Competing interests: The authors declare they have no conflict of interest.

Figures

Fig. 1.
Fig. 1.. Autocrine Activation of the Wnt/β-Catenin Pathway in Some Mammary Tumors from MMTV-CUX1 Transgenic Mice.
Cell lines were established from two mammary tumors that developed in transgenic mice carrying a MMTV-p75 CUX1 transgene: an adenosquamous carcinoma from mouse #p75-80 and a solid carcinoma from mouse #p75-534. The two cell lines were analyzed for Wnt gene expression (A), nuclear β-catenin expression (B), and TCF/β-catenin transcriptional activity (C). (A) mRNA levels of Wnt ligand genes were measured by RT-qPCR. Results of triplicate experiments are shown. * P Value<0.05 on a Welch corrected T test. Und: Undetected. (B) Cells were analyzed by indirect immunofluorescence using antibodies specific for the active, non-phosphorylated form of β-Catenin. Histogram shows the relative mean nuclear signal for β-Catenin as measured using the ImageJ software. The value for p75-534 was set to 1. * P Value<0.05 on a Welch corrected T test. A representative image of each cell line is shown on the right. Scale bar: 20µm. (C) The TOP/FOP luciferase reporter assay was performed in the p75-534 and p75-80 mammary tumor cell lines. In addition, p75-80 cells were cotransfected with a vector expressing either sFRP1, sFRP2 or SOST or an empty vector. Where indicated, niclosamide was added to the cells at the time of transfection. Results of 3 independent transfections are shown. * P Value<0.05 on a Welch corrected T test. A schematic representation of the reporter constructs is shown.
Fig. 2.
Fig. 2.. CUX1 Is Required for Maximal Expression of Wnt Genes in Human Tumor Cell Lines.
CUX1 specific or scrambled siRNA were transfected in a panel of 6 human cancer cell lines from breast (A), ovarian (B) and lung (C) cancers. 3 days later total mRNA was isolated and quantitative RT-PCR was performed using HPRT1 mRNA as a control. The values represent fold difference in mRNA expression between cells treated with CUX1 or scrambled siRNA. (Und: undetected). * P Value<0.05 on a Welch corrected T test.
Fig. 3.
Fig. 3.. Ectopic Expression of p110 CUX1 Leads to Autocrine Activation of the Wnt/β-Catenin Pathway in Human Tumor Cell Lines.
(A) HEK293 cells were infected with retroviruses to establish cells stably carrying a vector that expresses p110 CUX1 or nothing (vector). Nuclear and cytoplasmic extracts were analyzed by immunoblotting with the indicated antibodies. (B) The TOP or FOP luciferase reporters were introduced into HEK293 cells together with 500 ng of a vector expressing p110 CUX1 or an empty vector. Luciferase activity was measured 36 hours after transfection. Where indicated, a vector expressing either sFRP1, sFRP2, SOST or DKK1 was transfected as well, or niclosamide or IWP-2 was added to the cells at the time of transfection. Results of 3 independent transfections are shown. * P Value<0.05 on a Welch corrected T test. (C) Hs578t and MCF7 breast cancer cells were stably infected with either a lentivirus expressing p110 CUX1 or an empty lentivirus (vector). Nuclear and cytoplasmic extracts were analyzed by immunoblotting with the indicated antibodies. (D) The TOP or FOP luciferase reporters were introduced into Hs578t and MCF7 cells together with 500 ng of a vector expressing p110 CUX1 or an empty vector. Luciferase activity was measured 36 hours after transfection.* P Value<0.05 on a Welch corrected T test.
Fig. 4.
Fig. 4.. Activation of the Wnt/β-Catenin Pathway in MMTV-CUX1 Mammary Tumors Is Associated with High Expression of Glis1.
Expression profiling was performed on microdissected tumor cells from 17 mammary tumors that developed in MMTV-p110 or p75 CUX1 transgenic mice, including 8 solid carcinomas (p110-416, p110-314, p110-360, p75-534, p75-150, p110-143, p75-129, p110-225), 4 adenosquamous carcinomas (p75-101, p75-94, p75-80, p75-47), 1 adenoma (p110-98), 2 adenomyoepitheliomas (p75-90, p110-374), and 1 adenocarcinoma (p75-216). The complete expression profiles are available on the Gene Expression Omnibus (GEO) repository under accession number GSE54804. The figure shows a heatmap of mammary tumors grouped according to an unsupervised hierarchical clustering of Wnt gene expression. Expression of Glis1, as well as Vim, Cdh1, Cdh2, Snai1, Snai2, Ocln and Twist1 in each tumor is shown below. The cluster of “high-Wnt” tumors is boxed in yellow and the cluster of “low-Wnt” tumors is boxed in blue. Each column represents one tumor, with the transgene (p110 or p75 CUX1) and mouse ID number indicated below.
Fig. 5.
Fig. 5.. Correlation Between WNT, CUX1 and GLIS1 Gene Expression in a Human Breast Tumor Dataset.
(A) Heatmap of a human breast tumor dataset sorted according to WNT genes expression using the BreSAT algorithm. Expression of CUX1, GLIS1, VIM, TWIST1, SNAI1, CDH2, SNAI2, OCLN and CDH1 in each tumor is shown below. (B) CUX1 and GLIS1 expression in the top 25% and bottom 25% samples sorted according to WNT genes expression. * indicates p<0.05, ** <0.01, *** <0.001 on a Welch-corrected student's T test. (C) CDH1, OCLN, CDH2, SNAI1, SNAI2, TWIST1 and VIM expression in the top 25% and bottom 25% samples sorted according to Wnt genes expression. * indicates p<0.05, ** <0.01, *** <0.001 on a Welch-corrected student's T test.
Fig. 6.
Fig. 6.. Glis1 expression in MMTV-CUX1 Tumor Cell line correlates to activation of the Wnt/β-Catenin pathway.
(A) Cells of the “non-Wnt” p75-534 tumor line were infected with a lentivirus expressing GLIS1 or nothing (vector). Two days later, Wnt mRNA levels were measured by RT-qPCR. Und: Undetected. Results of triplicate experiments are shown. * P Value<0.05 on a Welch corrected T test. (B) β-Catenin expression was analyzed by immunoblotting in the same cells as in A.
Fig. 7.
Fig. 7.. GLIS1 and p110 CUX1 Cooperate To Activate the Wnt/β-Catenin Pathway and to Stimulate Cell Motility and Invasiveness in Nontransformed Mammary Epithelial Cells.
We established populations of MCF10A cells stably carrying lentiviral vectors that express nothing (vector), GLIS1, p110 CUX1, or both GLIS1 and p110 CUX1. (A) Wnt gene mRNA levels were measured by RT-qPCR. Und: Undetected. * P Value<0.05 on a Welch corrected T test when comparing the p110+Glis1 samples vs. each of the other 3. (B) β-Catenin protein levels were measured by immunofluorescence using antibodies specific for the active, non-phosphorylated form of the protein. Histogram shows the mean nuclear signal for β-Catenin for at least 50 cells per condition. * P Value<0.05 on a Welch corrected T test. A representative image of each condition is shown below. Scale bar: 20µm. (C) β-Catenin protein levels were measured by immunoblotting using antibodies specific for the active, non-phosphorylated form of the protein. γ-Tubulin is shown as a loading control. (D) MCF10A cells were transiently transfected with either the TOP of the FOP luciferase reporter, a vector expressing p110 CUX1 or an empty vector, and a vector expressing GLIS1 or the corresponding empty vector. Luciferase activity was measured in 3 independent transfections. * P Value<0.05 on a Welch corrected T test. (E) MCF10A cells ectopically expressing GLIS1, p110 CUX1 or both were imaged by time-lapse video microscopy and their speed of migration was quantified. The average of 3 independent experiments is shown with error bars representing standard error. ** P Value<0.01, *** <0.001 on 3 combined Welch corrected T tests using the Fisher method. (F) Time-lapse video microscopy was carried out as in E and distance migrated from the point of origin was quantified. (G) MCF10A cells overexpressing GLIS1 and p110 CUX1 alone or both were subjected to inverted Boyden chamber invasion assays. The percentage of cells able to migrate more than 20 µm into the matrix is shown for each line. The average of 3 independent experiments is shown. (H) Confocal Z-Stacks acquired 10 µm apart are aligned to demonstrate invasion of MCF10A-derivative cells into the matrix. Representative Z-stack for each condition is displayed. The leftmost image represents cells at the surface of the matrix (Depth = 0).
Fig. 8.
Fig. 8.. GLIS1 and p110 CUX1 Cooperate To Activate the Wnt/β-Catenin Pathway and to Stimulate Cell Motility in Breast Cancer Cells.
We established populations of Hs578t cells stably carrying lentiviral vectors that express nothing (vector), GLIS1, p110 CUX1, or both GLIS1 and p110 CUX1. (A) Wnt gene mRNA levels were measured by RT-qPCR. Und: Undetected. * P Value<0.05 on a Welch corrected T test. (B) β-Catenin protein levels were measured by indirect immunofluorescence using antibodies specific for the active, non-phosphorylated form of the protein. Histogram shows the mean nuclear signal for β-Catenin for at least 50 cells per condition. * P Value<0.05 on a Welch corrected T test. A representative image of each condition is shown below. Scale bar: 20µm. (C) Hs578t cells were transiently transfected with either the TOP of the FOP luciferase reporter, and suboptimal amounts (50 ng) of effector plasmids coding for nothing (−), p110 CUX1 or GLIS1. Luciferase activity was measured in 3 independent transfections. * P Value<0.05 on a Welch corrected T test. (D) Hs578t cells ectopically expressing GLIS1, p110 CUX1 or both were imaged by time-lapse video microscopy and their speed of migration was quantified. The average of 3 independent experiments is shown with error bars representing standard error. ** P Value<0.01, *** <0.001 on a Welch corrected T test. (E) Time-lapse video microscopy was carried out as in D and distance migrated from the point of origin was quantified.

Similar articles

Cited by

References

    1. Abraham G., Kowalczyk A., Loi S., Haviv I., Zobel J. (2010). Prediction of breast cancer prognosis using gene set statistics provides signature stability and biological context. BMC Bioinformatics 11, 277 10.1186/1471-2105-11-277 - DOI - PMC - PubMed
    1. Akiri G., Cherian M. M., Vijayakumar S., Liu G., Bafico A., Aaronson S. A. (2009). Wnt pathway aberrations including autocrine Wnt activation occur at high frequency in human non-small-cell lung carcinoma. Oncogene 28, 2163–2172 10.1038/onc.2009.82 - DOI - PMC - PubMed
    1. Bafico A., Liu G., Goldin L., Harris V., Aaronson S. A. (2004). An autocrine mechanism for constitutive Wnt pathway activation in human cancer cells. Cancer Cell 6, 497–506 10.1016/j.ccr.2004.09.032 - DOI - PubMed
    1. Benhaj K., Akcali K. C., Ozturk M. (2006). Redundant expression of canonical Wnt ligands in human breast cancer cell lines. Oncol. Rep. 15, 701–707 10.3892/or.15.3.701 - DOI - PubMed
    1. Cadieux C., Kedinger V., Yao L., Vadnais C., Drossos M., Paquet M., Nepveu A. (2009). Mouse mammary tumor virus p75 and p110 CUX1 transgenic mice develop mammary tumors of various histologic types. Cancer Res. 69, 7188–7197 10.1158/0008-5472.CAN-08-4899 - DOI - PubMed