. 2014 Sep 12;3(10):924-36.
doi: 10.1242/bio.20148185.

Phosphoinositide 3-kinase p85beta regulates invadopodium formation

Affiliations

Phosphoinositide 3-kinase p85beta regulates invadopodium formation

Ariel E Cariaga-Martínez et al. Biol Open. .

Abstract

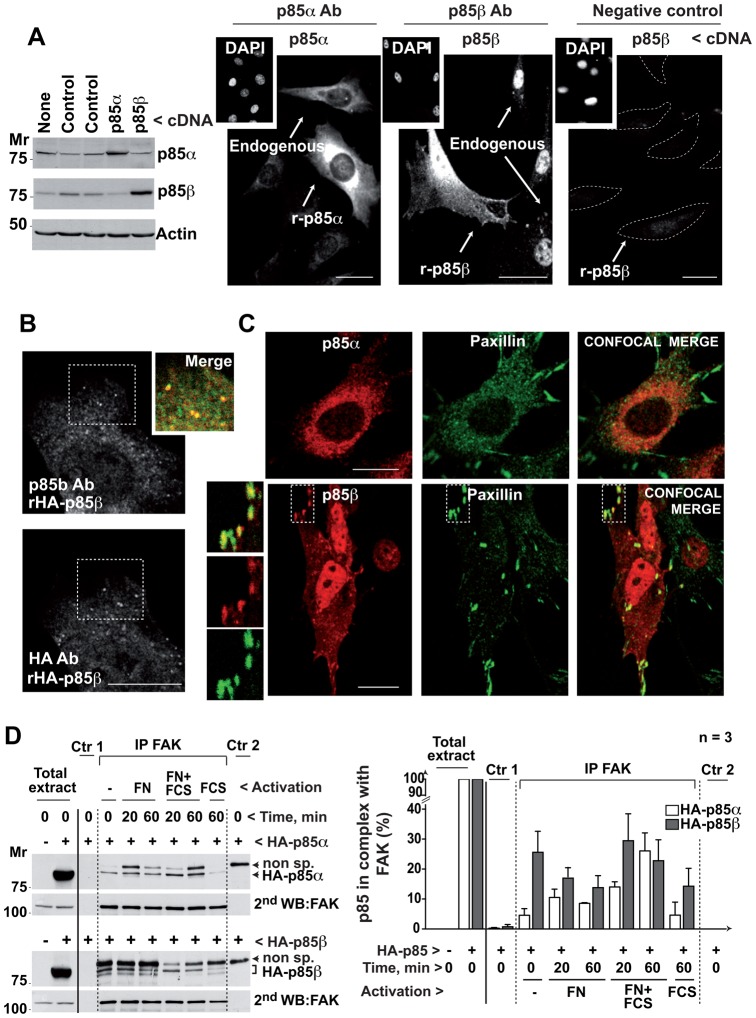
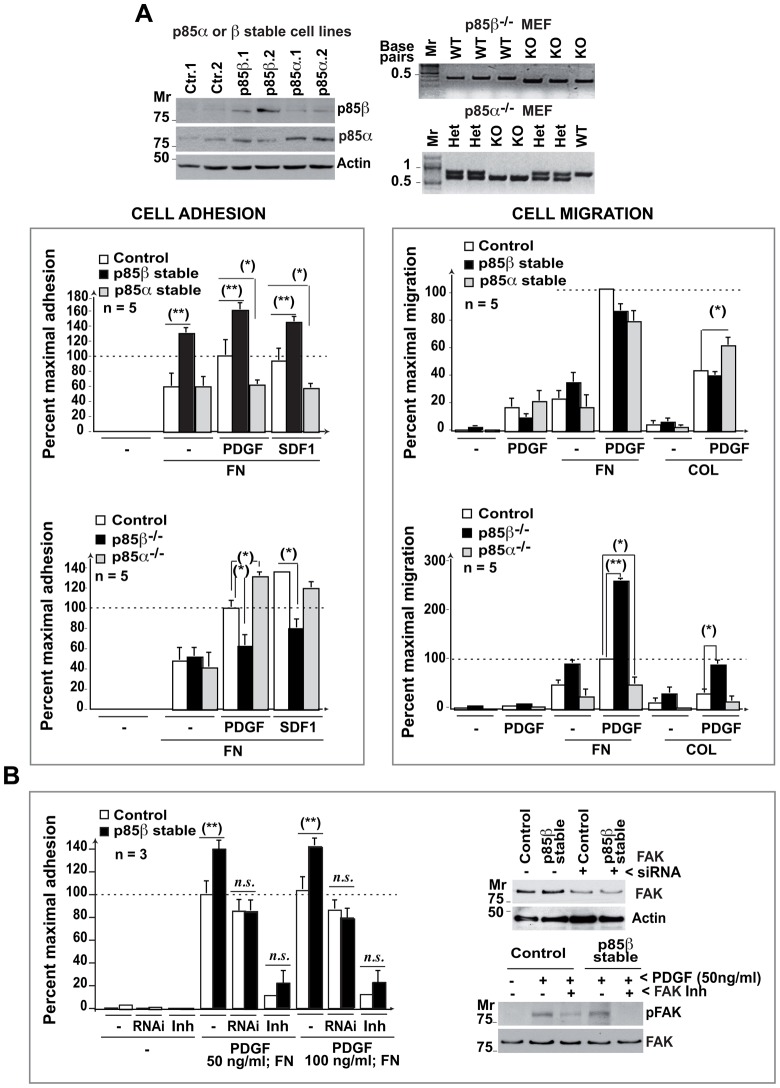
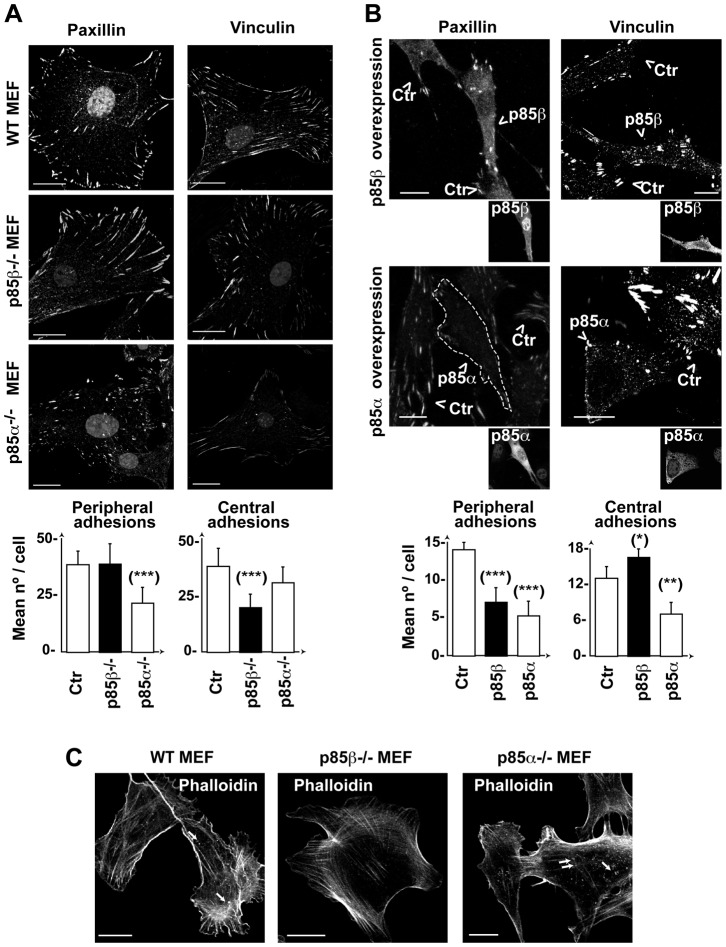
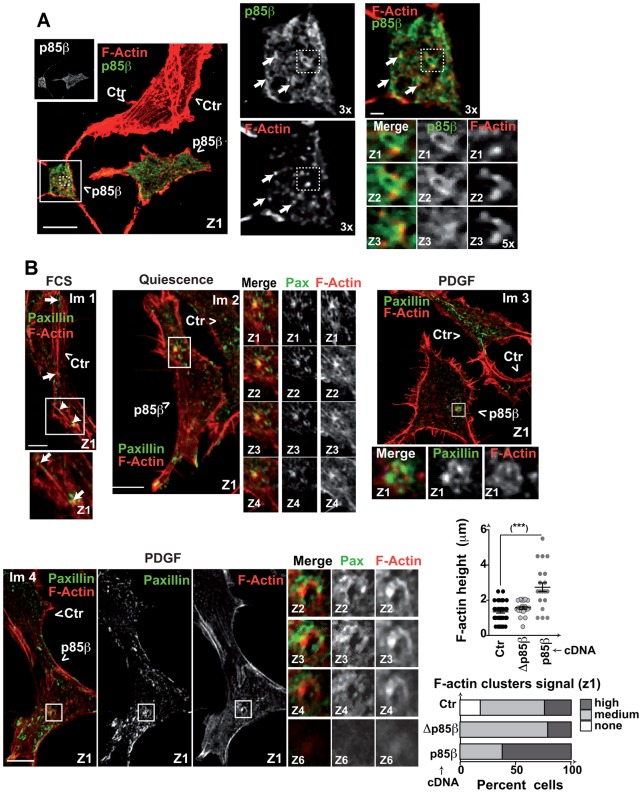
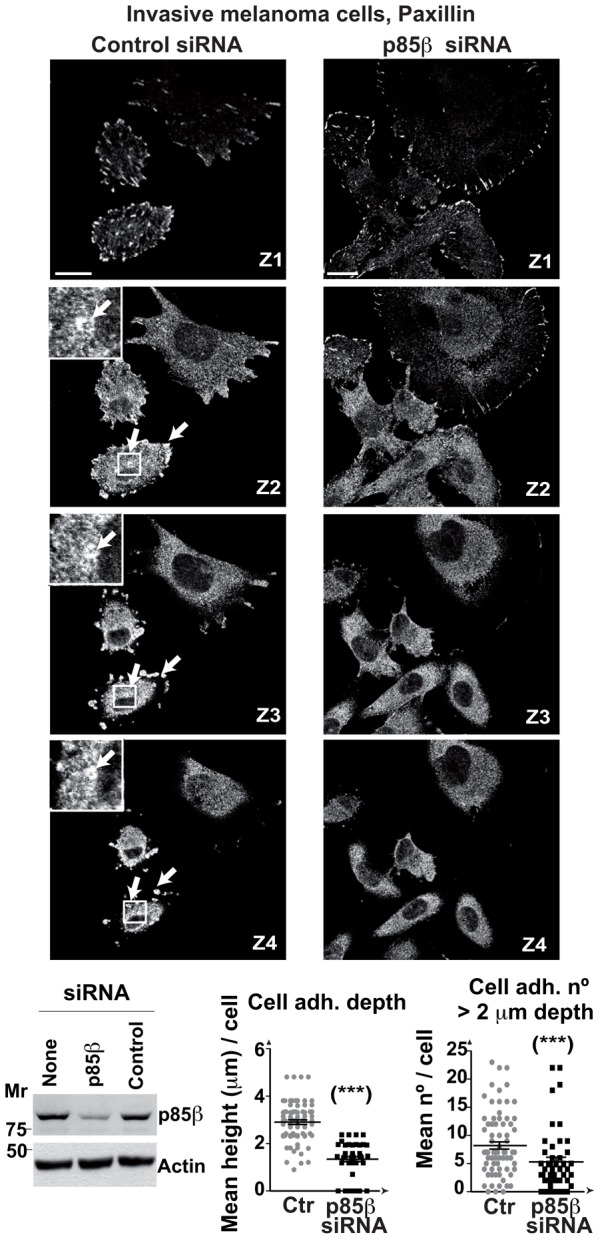
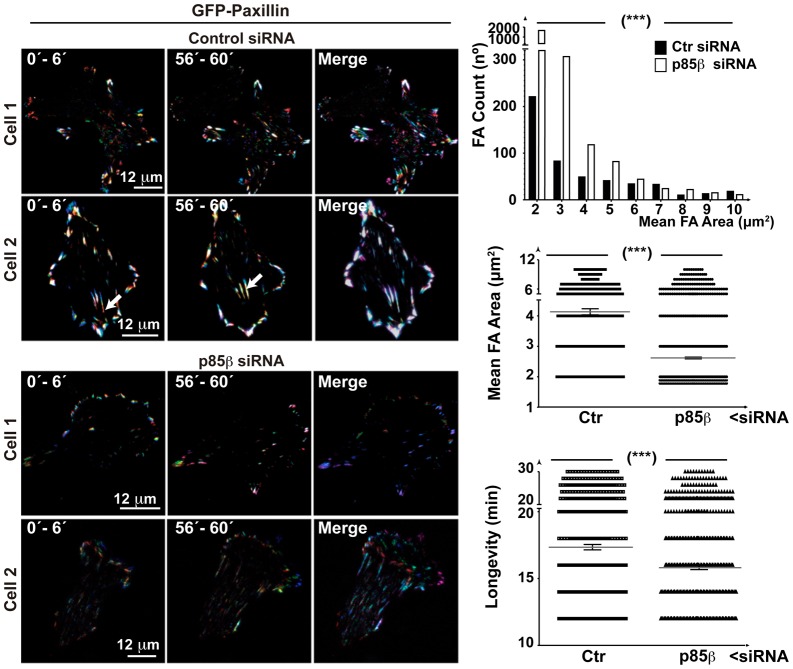
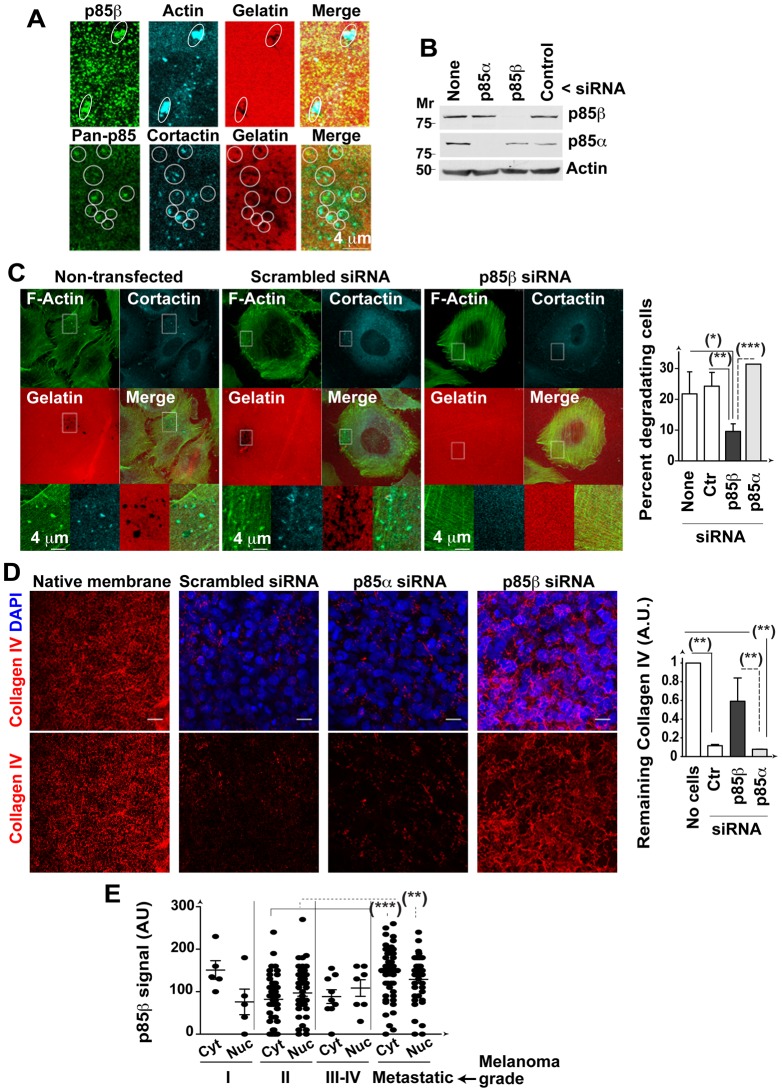
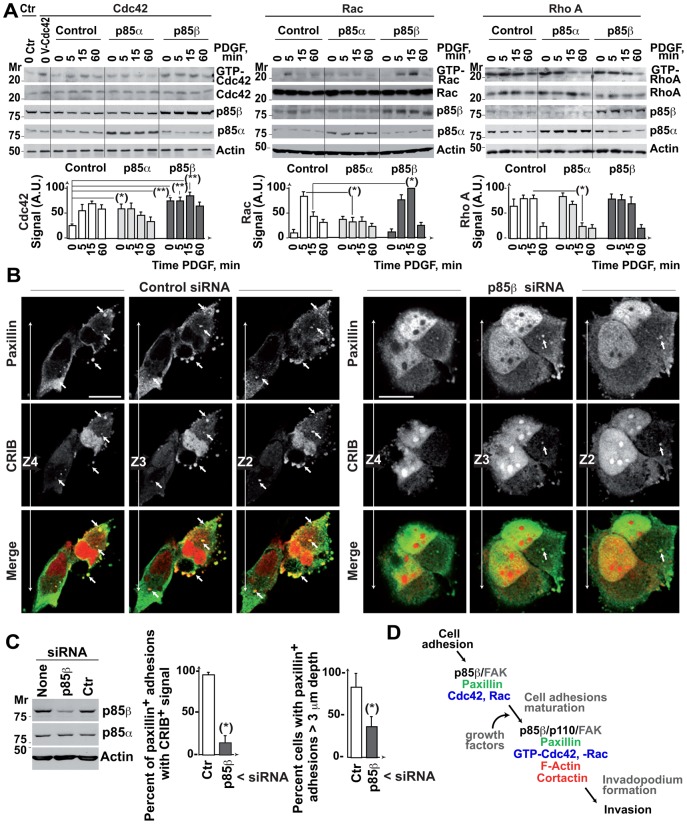
The acquisition of invasiveness is characteristic of tumor progression. Numerous genetic changes are associated with metastasis, but the mechanism by which a cell becomes invasive remains unclear. Expression of p85β, a regulatory subunit of phosphoinositide-3-kinase, markedly increases in advanced carcinoma, but its mode of action is unknown. We postulated that p85β might facilitate cell invasion. We show that p85β localized at cell adhesions in complex with focal adhesion kinase and enhanced stability and maturation of cell adhesions. In addition, p85β induced development at cell adhesions of an F-actin core that extended several microns into the cell z-axis resembling the skeleton of invadopodia. p85β lead to F-actin polymerization at cell adhesions by recruiting active Cdc42/Rac at these structures. In accordance with p85β function in invadopodium-like formation, p85β levels increased in metastatic melanoma and p85β depletion reduced invadopodium formation and invasion. These results show that p85β enhances invasion by inducing cell adhesion development into invadopodia-like structures explaining the metastatic potential of tumors with increased p85β levels.

Keywords: cell adhesion; invadopodium; invasion; metastasis; p85β.


Conflict of interest statement

Competing interests: The authors declare no competing financial interests.

Figures

Fig. 1.
Fig. 1.. p85β localizes at adhesion plaques and associates with FAK.
(A) NIH3T3 cells, untransfected or transfected with cDNA encoding p85α or p85β (48 h), were tested in Western blot (WB). Other cells were examined by immunofluorescence (IF) using p85α- or p85β (K1123)-specific antibodies. Insets show DAPI staining for nuclear DNA. To control K1123 specificity, some of the cells that were stained with the antibody (Ab), were preincubated with antigenic peptide. A dashed line outlines the cell membrane; transfected cells are indicated. (B) NIH3T3 cells transfected with HA-p85β cDNA were stained simultaneously with K1123 polyclonal Ab and an anti-hemagglutinin (HA) mAb; the inset shows a magnification of the indicated region. (C) NIH3T3 cells were transfected as above and tested in IF by simultaneous staining of paxillin and p85α or p85β. Insets show magnifications. (D) NIH3T3 cells were transfected with cDNA encoding HA-p85α or HA-p85β (48 h), then incubated without serum (16 h) and activated with 10% serum or in FN-coated wells with and without serum for 20 or 60 min. Cell extracts (500 µg) were immunoprecipitated with anti-FAK Ab. Negative controls included extract + protein A (Ctr 1) and protein A + Ab (Ctr 2); Extracts (50 µg) and immunoprecipitates were analyzed in WB using anti-HA Ab. Loading was controlled in WB using anti-FAK Ab. The graph shows HA signal intensity relative to HA-p85 expression in whole cell extract, considered 100% (mean ± s.d.; n  =  3). Bar  =  12 µm.
Fig. 2.
Fig. 2.. p85β regulates cell adhesion.
(A) p85α or p85β expression was analyzed in WB in stably transfected NIH3T3 cells. Freshly isolated MEF (from WT, p85α−/− or p85β−/− mice) were genotyped by PCR. A fraction of the cells were activated with PDGF (50 ng/ml) and used in an adhesion assay, alone or on fibronectin (FN), or in a migration assay on transwells coated with a thin layer of FN or collagen (COL)(10 µg/ml). Graphs show the percent of response relative to the maximal in control cells (100%; mean ± s.d.; n  =  5). (B) Control and p85β-overexpressing NIH3T3 cells were transfected with FAK siRNA (48 h) or preincubated with FAK inhibitor (10 µM PF-573228) for 1 h at 37°C prior to stimulation with 50 or 100 ng/ml PDGF (indicated) on FN. The cells were assayed in an adhesion assay (as in A). Some of the cells transfected with siRNA or treated with the inhibitor were lysed and lysates examined in WB using were anti-FAK Ab or anti-pTyr576/577-FAK Ab (indicated). n.s. =  non-statistical significance; ** P<0.01, * P<0.05; Student's t-test.
Fig. 3.
Fig. 3.. p85β modulates adhesion structures by increasing central adhesions.
(A,B) WT, p85α−/− or p85β−/− MEF (A,C) or NIH3T3 cells transfected with p85α or p85β (B) were stained with anti-paxillin or -vinculin Ab. Images show the first confocal section from the adhesion plane. Transfected cells were identified by anti-p85β Ab (K1123) or -pan-p85 Ab (for p85α) (insets) and are indicated by an arrowhead. Graphs show the number of peripheral or central adhesions per cell (mean ± s.d.; n  =  25). Focal contacts and focal adhesions near the cell membrane were considered peripheral; rounded adhesions at the cell center (not in contact with the membrane) were considered central adhesions. (C) MEF as in (A) were stained using phalloidin-TRITC. Arrows indicate F-actin dots at the cell first z-section, in contact with the matrix. Bar  =  12 µm. *** P<0.001, ** P<0.01, *-P<0.05; Student's t-test.
Fig. 4.
Fig. 4.. p85β expression induces formation of F-actin-positive adhesions.
(A) NIH3T3 cells transfected with CFP combined with control or HA-p85β cDNA (48 h) were evaluated by immunofluorescence using anti-HA Ab and phalloidin-TRITC. Representative images of the first confocal section (z1). Insets show 3× magnification of indicated areas, small insets show 5× magnification of serial z-sections, arrows indicate areas of phalloidin and HA proximal staining. Transfected cells were tracked with CFP. (B) NIH3T3 cells were transfected with CFP combined with control HA-p85α, -p85β or -Δp85β cDNA (48 h). Cells were tested after incubation in serum-free medium (2 h), after activation with PDGF (50 ng/ml; 10 min) or in exponential growth (with serum). Cells were stained with phalloidin-TRITC and paxillin. The graphs show the percentage of paxillin+ clusters/rosettes with F-actin signals scored as high (similar to that of cortical F-actin), medium (lower than cortical F-actin signal), or none, and height of F actin+ clusters (µm) in different cells. Bar  =  12 µm. Step size, 0.5 µm. ***-P-<0.001; Student's t-test.
Fig. 5.
Fig. 5.. p85β is essential for maintenance of cell adhesions depth in melanoma cells.
BLM cells were transfected with control or p85β siRNA (48 h), then stained with anti-paxillin Ab. Representative images at indicated z-sections; bar  =  12 µm. Arrows indicate adhesions that extended >2 µm in the z-axis (1 µm step size). Cell extracts were analyzed in WB. Graphs show the number of adhesions (>2 µm depth), and the mean depth of cell adhesions in control and p85β-depleted cells (mean ± s.d.; n  =  25). (***) P <0.001; Student's t test.
Fig. 6.
Fig. 6.. p85β mediates cell adhesion stability and maturation.
BLM cells were transfected with control or p85β siRNA (24 h), then transfected with a plasmid encoding GFP-paxillin (24 h). TIRFM video microscopy was carried out at a depth of 70 nm. To evaluate the longevity and trajectory of cell adhesions, we assigned a different color to the paxillin signal collected in individual time frames and merged image sets; a white color (resulting from the mixture of colors) indicates long-lived adhesions. Left and center columns show the merge of three time points; the right column shows five time points spanning 30 frames (1 h). In control cells, some adhesions migrate to the cell center, with a parallel signal increase (indicated with an arrow). Graphs show the number of cell adhesions (top), differences in areas (center), and adhesion longevity (bottom) in n  =  12 cells in independent experiments. Mean ± s.e.m. are shown. *** P <0.001; Wilcoxon matched-pairs signed-rank test. Bar  =  12 µm.
Fig. 7.
Fig. 7.. p85β is essential for melanoma invasion.
(A) BLM cells in exponential growth were plated onto fluorescent gelatin-coated coverslips (6 h) and stained with anti-p85β or -pan-p85 Ab in combination with anti-cortactin Ab or phalloidin. White circles indicate areas in which p85 concentrates, which coincided with cortactin or actin clusters in >50% of cases. (B,C) BLM cells were transfected with p85α or p85β siRNA (48 h), plated onto coverslips and stained with phalloidin-FITC and anti-cortactin Ab. WB analysis confirms siRNA efficiency (B). Representative control or p85β silenced cells; insets show magnification of indicated areas. Graph shows the percentage of cells that degraded the matrix in distinct conditions (mean ± s.d.) (C). (D) BLM cells as in (C) were seeded on wild type mice basement membranes (72 h). Basement membrane invasion was analyzed by IF staining of collagen IV (red) and cell nuclei (DAPI, blue). The graph shows the signal (arbitrary units, AU) of the collagen signal remaining after incubation, determined in several z-sections (100%; mean ± s.e.m.; n  =  3). (E) p85β expression detected in immunohistochemistry using p85β Ab (K1123) in a tissue array of different grades of melanoma (indicated). The graph shows p85β signal intensity (AU) in the nucleus (Nuc) and cytosol (Cyt). Bar  =  4 µm. * P <0.05, ** P <0.01, *** P <0.001; Student's t-test.
Fig. 8.
Fig. 8.. p85β regulates active Cdc42 and Rac localization to deep adhesions.
(A) NIH3T3 cell lines expressing p85α or p85β were incubated without serum (2 h), then activated with PDGF (50 ng/ml) for the times indicated. A subset of cells was transfected with Myc-Cdc42. Cell extracts were incubated with purified bacterially bait (GST-rhotekin-RBD for RhoA, GST-Pak1 for Rac/Cdc42, GST-NWASP for Cdc42). As a positive control, NIH3T3 cells were transfected with V12-Cdc42. Total GTPase levels and pulled-down GTP-forms were analyzed in WB (using anti-Myc Ab for Cdc42). The graphs show normalized signal intensity (mean ± s.d.; n  =  3) (AU). (B) BLM cells were transfected with control or p85β siRNA in combination with CFP-CRIBPak1 (48 h). The figure shows a representative image in three sequential z-sections. Arrowheads indicate cell adhesions that colocalize with active CFP-CRIB, some organized as rosettes. Bar  =  12 µm. (C) Reduction of p85β levels by siRNA transfection as analyzed in WB. Graphs show the percentage of paxillin positive adhesions containing CRIB signal and the percentage of cells showing adhesions of >3 µm depth. * P <0.05 ** P <0.01; Student's t-test. (D) When tumors augment p85β expression, cell adhesions increase their p85β/p110 content (in complex with FAK). This p85β increase, in the presence of growth factors, enables the local accumulation of GTP-Cdc42/Rac at cell adhesion and the generation of a z-axis F-actin core, necessary for invadopodium formation.

References

    1. Albiges-Rizo C., Destaing O., Fourcade B., Planus E., Block M. R. (2009). Actin machinery and mechanosensitivity in invadopodia, podosomes and focal adhesions. J. Cell Sci. 122, 3037–3049 10.1242/jcs.052704 - DOI - PMC - PubMed
    1. Alcázar I., Marqués M., Kumar A., Hirsch E., Wymann M., Carrera A. C., Barber D. F. (2007). Phosphoinositide 3-kinase gamma participates in T cell receptor-induced T cell activation. J. Exp. Med. 204, 2977–2987 10.1084/jem.20070366 - DOI - PMC - PubMed
    1. Bartolomé R. A., Molina-Ortiz I., Samaniego R., Sánchez-Mateos P., Bustelo X. R., Teixidó J. (2006). Activation of Vav/Rho GTPase signaling by CXCL12 controls membrane-type matrix metalloproteinase-dependent melanoma cell invasion. Cancer Res. 66, 248–258 10.1158/0008-5472.CAN-05-2489 - DOI - PMC - PubMed
    1. Berginski M. E., Vitriol E. A., Hahn K. M., Gomez S. M. (2011). High-resolution quantification of focal adhesion spatiotemporal dynamics in living cells. PLoS ONE 6, e22025.10.1371/journal.pone.0022025 - DOI - PMC - PubMed
    1. Block M. R., Badowski C., Millon-Fremillon A., Bouvard D., Bouin A. P., Faurobert E., Gerber-Scokaert D., Planus E., Albiges-Rizo C. (2008). Podosome-type adhesions and focal adhesions, so alike yet so different. Eur. J. Cell Biol. 87, 491–506 10.1016/j.ejcb.2008.02.012 - DOI - PubMed