. 2014 Nov 15;127(Pt 22):4927-39.
doi: 10.1242/jcs.155861. Epub 2014 Sep 12.

A novel interaction between Rab7b and actomyosin reveals a dual role in intracellular transport and cell migration

Affiliations

A novel interaction between Rab7b and actomyosin reveals a dual role in intracellular transport and cell migration

Marita Borg et al. J Cell Sci. .

Abstract

Rab proteins are small GTPases that regulate transport between the different compartments of the endomembrane system in eukaryotic cells. Here, we show that Rab7b, a Rab that controls the transport between late endosomes and the trans Golgi network, interacts directly with myosin II. We illustrate the functional relevance of this interaction, demonstrating that myosin II mediates the transport of Rab7b endosomes, as Rab7b dynamics are strongly affected after myosin II depletion or inhibition. We also demonstrate that a member of the Rab family regulates actin remodeling and, consequently, influences cell adhesion, polarization and migration. We find the molecular mechanism by which Rab7b influences stress fiber formation - through controlling the activation status of the small GTPase RhoA and therefore influencing myosin light chain phosphorylation. Our findings reveal a newly identified role for Rab proteins outside of their canonical role in intracellular trafficking, identifying Rab7b as a coordinator of cytoskeletal organization.

Keywords: Actomyosin; Endosomes; Rab proteins; Rab7b.


Figures

Fig. 1.
Fig. 1.
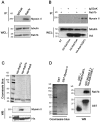
Rab7b interacts with myosin II. (A) Lysates of monocyte-derived dendritic cells (MDDCs) were subjected to immunoprecipitation with an antibody against Rab7b or an isotype control (IgG2aK). Whole cell lysates (WCL) and immunoprecipitates (IP) were subjected to western blot analysis using antibodies specific to myosin II, tubulin or Rab7b. (B) Lysates of control HeLa cells (NT) or cells expressing HA–Rab7bwt or HA–Rab7bQ67L were subjected to immunoprecipitation with an antibody against Rab7b or an isotype control (IgG2aK). Whole cell lysates and immunoprecipitates were subjected to western blot analysis using antibodies specific to myosin II, tubulin or HA. (C) Upper panel: Coomassie Blue staining of bacterially expressed His–Rab7a, His–Rab7b and His–Rab9 purified using cobalt-coated Dynabeads. Lower panel: bacterially expressed and purified His–Rab7a, His–Rab7b or His–Rab9 were loaded with GTPγS and incubated with lysates from HeLa cells. Proteins were pulled down using cobalt-coated Dynabeads and subjected to western blot (WB) analysis using antibodies against His and myosin II. (D) Left panel: Coomassie Blue staining of bacterially expressed GST and GST–myosin-II-tail purified using glutathione resin. Right panel: purified GST or GST–myosin-I-tail was incubated with purified His–Rab7bQ67L. Samples were subjected to affinity chromatography followed by western blot analysis using antibodies specific to GST and Rab7b.
Fig. 2.
Fig. 2.
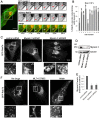
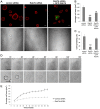
Myosin II regulates the transport of Rab7b-positive endosomes. (A) HeLa cells co-transfected with GFP–myosin-II and mCherry–Rab7b were imaged by using a spinning-disk confocal microscope for the indicated time points. The red and white arrows indicate a vesicle positive for both GFP–myosin-II and mCherry–Rab7b moving toward the Golgi. See also supplementary material Movie 1. (B) Quantification of the overlap between Rab7b and myosin II. HeLa cells were transfected with GFP–myosin-II and mCherry–Rab7b. The percentage of Rab7b vesicles positive for myosin II was calculated by using an object-based colocalization analysis with ImageJ software. Total number of objects counted (n) is shown for ten different cells. (C) HeLa cells that had been treated with either control siRNA or two different siRNAs against myosin II (siRNA 1 and siRNA 2), and transfected with GFP–Rab7b, were imaged with a spinning-disk confocal microscope. Magnifications of the boxed areas are shown in the respective lower insets. See also supplementary material Movie 2. (D) HeLa cells treated with either control siRNA or two different siRNAs against myosin II were subjected to western blot analysis with antibodies against myosin II and tubulin as a loading control. (E) Quantification of myosin II expression. The intensities of the bands were quantified by using densitometry, normalized against the amount of tubulin, and plotted relative to the intensities obtained in cells transfected with control siRNA. The values represent the mean±s.d. of five independent experiments. (F) HeLa cells transfected with GFP–Rab7b were imaged using a spinning-disk confocal microscope before addition of the inhibitory mix ML7 with Y27632 (no drugs), 40 minutes after addition of 30 µM ML7 and 10 µM Y27632, and after washing away the inhibitory drugs (wash). Magnifications of the boxed areas are shown in the respective lower insets. Scale bars: 10 µm (A,F). See also supplementary material Movies 3–5.
Fig. 3.
Fig. 3.
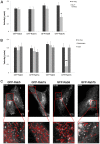
Inhibition of myosin II specifically slows down Rab7b endosomes. (A–C) HeLa cells were transfected with GFP–Rab5, GFP–Rab7a, GFP–Rab9 or GFP–Rab7b, imaged by using a spinning-disk confocal microscope, and the velocity of single endosomes was quantified using the manual tracking plugin of the program ImageJ. The graphs represent the quantification of the mean velocity of single endosomes (A) both before addition (no drug) and after addition of the inhibitory mix ML7 and Y27632, and (B) before addition (no drug), after addition of blebbistatin, and after wash. At each of these conditions, a minimum of 30 endosomes (from three independent experiments) were measured over time. Error bars indicate mean±s.e.m. *P<0.05; **P<0.01. (C) HeLa cells were transfected with GFP–Rab5, GFP–Rab7a, GFP–Rab9 or GFP–Rab7b, and treated with blebbistatin (25 µM) for 40 minutes at 37°C before imaging with a spinning-disk confocal microscope. Imaging time (min:s) is indicated in the top left corner. In the lower insets, magnifications of the respective boxed areas are shown. Red arrows indicate endosomal movement tracked with IMARIS software over 3 minutes. Scale bars: 10 µM. See also supplementary material Movies 6, 7.
Fig. 4.
Fig. 4.
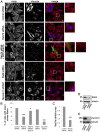
Rab7b regulates stress fibers formation. (A) HeLa cells that had been transfected with control siRNA, siRNA against Rab7b, Rab9, myosin II, or depleted for Rab7b and transfected afterward with GFP–Rab7b were fixed and stained as indicated. The images represent maximum-intensity projections of z-stacks. Magnifications of the boxed areas are shown in the insets. Scale bar: 10 µm. (B) Quantification of the percentage of cells with intact stress fibers. Data represents the mean±s.e.m. of three independent experiments (n>100). *P<0.05; ***P<0.001. (C) Quantification of Rab7b transcript levels after silencing. Rab7b mRNA levels were quantified by using real-time RT-PCR in HeLa cells that had been transfected with control siRNA or siRNA targeted toward Rab7b. The level of Rab7b mRNA was normalized to the amount of actin and plotted relative to the levels of Rab7b mRNA in the control sample. Data represents the average of ten independent experiments ±s.d. ***P<0.001. (D) HeLa cells that had been treated with either control siRNA or siRNA against Rab9 were subjected to western blot analysis with antibodies against Rab9 and tubulin as a loading control. (E) HeLa cells treated with either control siRNA or siRNA against myosin II (Myosin II siRNA 1) were subjected to western blot analysis with antibodies against myosin II and tubulin as a loading control.
Fig. 5.
Fig. 5.
Depletion of Rab7b suppresses cell spreading. (A) HeLa cells transfected with control siRNA, siRNA against Rab7b, or depleted for Rab7b and transfected afterward with GFP–Rab7b were plated onto fibronectin-coated coverslips and left to adhere for 1 hour. Samples were subsequently fixed and stained with Rhodamine-conjugated phalloidin and imaged by using fluorescence microscopy (upper panel). Lower panel shows transmission images for comparison. Scale bars: 10 µm. (B) Quantification of the average cell area (in µm2) of HeLa cells transfected with control siRNA, siRNA against Rab7b, or depleted for Rab7b and transfected afterward with GFP–Rab7b after 1 hour of adhesion onto fibronectin. Data represents the mean±s.d. of three independent experiments (n>100). **P<0.01; ***P<0.001. (C) The graph shows the percentage of fully spread cells (area >200 µm2) 1 hour after plating onto fibronectin-coated coverslips. Data represents the mean±s.d. of three independent experiments (n≥100). ***P<0.001. (D) Control cells (upper panels) and Rab7b-depleted cells (lower panels) were plated onto fibronectin-coated dishes, and cell spreading was imaged every 15 minutes (total time after plating is shown above the image). Scale bars: 10 µm. See also supplementary material Movie 8. (E) Quantification of the average cell area (in µm2) of HeLa cells transfected with control siRNA or siRNA against Rab7b during adhesion onto fibronectin-coated dishes at the indicated time points. Data represents the mean±s.e.m. of three independent experiments (n>100).
Fig. 6.
Fig. 6.
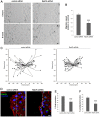
Rab7b silencing delays cell migration and polarization in response to wound. (A) Wound healing assay of HeLa cells that had been transfected with control siRNA or siRNA against Rab7b at time 0 (0 hours) and after 9 hours. (B) Quantification of the migration speed of control cells and Rab7b-depleted cells in wound healing assays. Data represents the mean±s.d. of three independent experiments (n≥100). (C) Representative track plots of the distances of migration of control cells (left plot) or Rab7b-depleted cells (right plot) in a wound healing assay. The movement of single cells into the wound was followed using manual tracking software. Individual tracks are shown so that each starts at the origin (distance 0). (D) Confluent monolayers of HeLa cells that had been transfected with control siRNA or siRNA against Rab7b were scratched with a pipette tip and fixed 2 hours later. Cells were immunostained with an antibody against giantin; actin was labeled with Rhodamine-conjugated phalloidin and nuclei with Hoechst 33258. White lines indicate the wound. The Golgi is labeled as + if the majority of it lies within a 120° angle facing the wound or as − if not. (E) Quantification of the percentage of cells with Golgi located in the 120° angle facing the wound. The graph shows the mean±s.d. of four independent experiments (n≥100). (F) Quantification of the percentage of the cells emanating lamellipodia into the wound area. The graph shows the mean±s.d. of four independent experiments (n≥100). ***P<0.001. Scale bars: 20 µm (A); 10 µm (D).
Fig. 7.
Fig. 7.
Rab7b regulates MLC phosphorylation by interfering with RhoA activity. (A) Lysates from HeLa cells that had been transfected with either control siRNA or siRNA against Rab7b were subjected to western blot analysis using antibodies against phosphorylated myosin light chain (P-MLC), total MLC and tubulin (as a loading control). (B) Quantification of P-MLC levels in control and Rab7b-depleted cells. The intensities of the bands from the western blot were normalized to the amount of tubulin and plotted relative to the intensities of P-MLC in the control siRNA sample. Quantification is based on three independent experiments and were determined by using ImageQuant Software (Amersham). Error bars represent the mean±s.e.m. (C) Lysates from HeLa cells that had been transfected with either control siRNA or siRNA against Rab7b were mixed with GST–Rhotekin-RBD bound to glutathione-agarose beads to precipitate the active form (GTP-bound) of RhoA. As a positive control, cells were loaded with GTPγS. The immunoprecipitate samples were subjected to western blot analysis using antibodies against RhoA and tubulin (loading control). (D) Quantification of the levels of active RhoA in control and Rab7b-depleted cells. Intensities of the bands from the western blot were quantified with ImageQuant, normalized to the amount of tubulin and plotted relative to the intensities of GTP-bound RhoA in the control sample. The values represent the mean±s.e.m. of five independent experiments.
Fig. 8.
Fig. 8.
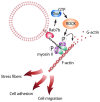
Model of Rab7b–myosin-II regulation of actin remodeling. Rab7b regulates MLC phosphorylation by modulating RhoA activity, and therefore actin remodeling, including the formation of stress fibers and the actin cytoskeleton reorganization that is necessary for processes such as cell adhesion and migration.

References

    1. Aguilar-Cuenca R., Juanes-García A., Vicente-Manzanares M. (2014). Myosin II in mechanotransduction: master and commander of cell migration, morphogenesis, and cancer. Cell. Mol. Life Sci. 71, 479–492. 10.1007/s00018-013-1439-5 - DOI - PMC - PubMed
    1. Allaire P. D., Seyed Sadr M., Chaineau M., Seyed Sadr E., Konefal S., Fotouhi M., Maret D., Ritter B., Del Maestro R. F., McPherson P. S. (2013). Interplay between Rab35 and Arf6 controls cargo recycling to coordinate cell adhesion and migration. J. Cell Sci. 126, 722–731. 10.1242/jcs.112375 - DOI - PubMed
    1. Amano M., Ito M., Kimura K., Fukata Y., Chihara K., Nakano T., Matsuura Y., Kaibuchi K. (1996). Phosphorylation and activation of myosin by Rho-associated kinase (Rho-kinase). J. Biol. Chem. 271, 20246–20249. 10.1074/jbc.271.34.20246 - DOI - PubMed
    1. Amano M., Chihara K., Kimura K., Fukata Y., Nakamura N., Matsuura Y., Kaibuchi K. (1997). Formation of actin stress fibers and focal adhesions enhanced by Rho-kinase. Science 275, 1308–1311. 10.1126/science.275.5304.1308 - DOI - PubMed
    1. Anitei M., Hoflack B. (2012). Bridging membrane and cytoskeleton dynamics in the secretory and endocytic pathways. Nat. Cell Biol. 14, 11–19. 10.1038/ncb2409 - DOI - PubMed

Publication types