Comprehensive analysis of stop codon usage in bacteria and its correlation with release factor abundance
- PMID: 25217634
- PMCID: PMC4215218
- DOI: 10.1074/jbc.M114.606632
Comprehensive analysis of stop codon usage in bacteria and its correlation with release factor abundance
Abstract
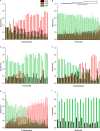
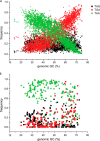
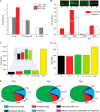
We present a comprehensive analysis of stop codon usage in bacteria by analyzing over eight million coding sequences of 4684 bacterial sequences. Using a newly developed program called "stop codon counter," the frequencies of the three classical stop codons TAA, TAG, and TGA were analyzed, and a publicly available stop codon database was built. Our analysis shows that with increasing genomic GC content the frequency of the TAA codon decreases and that of the TGA codon increases in a reciprocal manner. Interestingly, the release factor 1-specific codon TAG maintains a more or less uniform frequency (∼20%) irrespective of the GC content. The low abundance of TAG is also valid with respect to expression level of the genes ending with different stop codons. In contrast, the highly expressed genes predominantly end with TAA, ensuring termination with either of the two release factors. Using three model bacteria with different stop codon usage (Escherichia coli, Mycobacterium smegmatis, and Bacillus subtilis), we show that the frequency of TAG and TGA codons correlates well with the relative steady state amount of mRNA and protein for release factors RF1 and RF2 during exponential growth. Furthermore, using available microarray data for gene expression, we show that in both fast growing and contrasting biofilm formation conditions, the relative level of RF1 is nicely correlated with the expression level of the genes ending with TAG.
Keywords: Bacteria; Codon Usage; Protein Synthesis; Ribosome; Stop Codon; Translation; Translation Release Factor.
© 2014 by The American Society for Biochemistry and Molecular Biology, Inc.
Figures


Similar articles
-
Variation in Release Factor Abundance Is Not Needed to Explain Trends in Bacterial Stop Codon Usage.Mol Biol Evol. 2022 Jan 7;39(1):msab326. doi: 10.1093/molbev/msab326. Mol Biol Evol. 2022. PMID: 34751397 Free PMC article.
-
Stop codons in bacteria are not selectively equivalent.Biol Direct. 2012 Sep 13;7:30. doi: 10.1186/1745-6150-7-30. Biol Direct. 2012. PMID: 22974057 Free PMC article.
-
Coevolution between Stop Codon Usage and Release Factors in Bacterial Species.Mol Biol Evol. 2016 Sep;33(9):2357-67. doi: 10.1093/molbev/msw107. Epub 2016 Jun 13. Mol Biol Evol. 2016. PMID: 27297468 Free PMC article.
-
'Stop' in protein synthesis is modulated with exquisite subtlety by an extended RNA translation signal.Biochem Soc Trans. 2018 Dec 17;46(6):1615-1625. doi: 10.1042/BST20180190. Epub 2018 Nov 12. Biochem Soc Trans. 2018. PMID: 30420414 Review.
-
Translational termination efficiency in both bacteria and mammals is regulated by the base following the stop codon.Biochem Cell Biol. 1995 Nov-Dec;73(11-12):1095-103. doi: 10.1139/o95-118. Biochem Cell Biol. 1995. PMID: 8722026 Review.
Cited by
-
Complete Mitochondrial Genome Sequences of Korean Phytophthora infestans Isolates and Comparative Analysis of Mitochondrial Haplotypes.Plant Pathol J. 2022 Oct;38(5):541-549. doi: 10.5423/PPJ.OA.07.2022.0093. Epub 2022 Oct 1. Plant Pathol J. 2022. PMID: 36221926 Free PMC article.
-
The Role of +4U as an Extended Translation Termination Signal in Bacteria.Genetics. 2017 Feb;205(2):539-549. doi: 10.1534/genetics.116.193961. Epub 2016 Nov 30. Genetics. 2017. PMID: 27903612 Free PMC article.
-
R213I mutation in release factor 2 (RF2) is one step forward for engineering an omnipotent release factor in bacteria Escherichia coli.J Biol Chem. 2017 Sep 8;292(36):15134-15142. doi: 10.1074/jbc.M117.785238. Epub 2017 Jul 25. J Biol Chem. 2017. PMID: 28743745 Free PMC article.
-
Transient disome complex formation in native polysomes during ongoing protein synthesis captured by cryo-EM.Nat Commun. 2024 Feb 26;15(1):1756. doi: 10.1038/s41467-024-46092-3. Nat Commun. 2024. PMID: 38409277 Free PMC article.
-
Gene autoregulation by 3' UTR-derived bacterial small RNAs.Elife. 2020 Aug 3;9:e58836. doi: 10.7554/eLife.58836. Elife. 2020. PMID: 32744240 Free PMC article.
References
-
- Dong H., Nilsson L., Kurland C. G. (1996) Co-variation of tRNA abundance and codon usage in Escherichia coli at different growth rates. J. Mol. Biol. 260, 649–663 - PubMed
-
- Gilchrist M. A. (2007) Combining models of protein translation and population genetics to predict protein production rates from codon usage patterns. Mol. Biol. Evol. 24, 2362–2372 - PubMed
-
- Ikemura T. (1981) Correlation between the abundance of Escherichia coli transfer RNAs and the occurrence of the respective codons in its protein genes. J. Mol. Biol. 146, 1–21 - PubMed
Publication types
MeSH terms
Substances
LinkOut - more resources
Full Text Sources
Other Literature Sources
Molecular Biology Databases
Miscellaneous

