. 2014 Dec 12;289(50):34871-85.
doi: 10.1074/jbc.M114.571000. Epub 2014 Sep 12.

GPR126 protein regulates developmental and pathological angiogenesis through modulation of VEGFR2 receptor signaling

Affiliations

GPR126 protein regulates developmental and pathological angiogenesis through modulation of VEGFR2 receptor signaling

Hengxiang Cui et al. J Biol Chem. .

Abstract

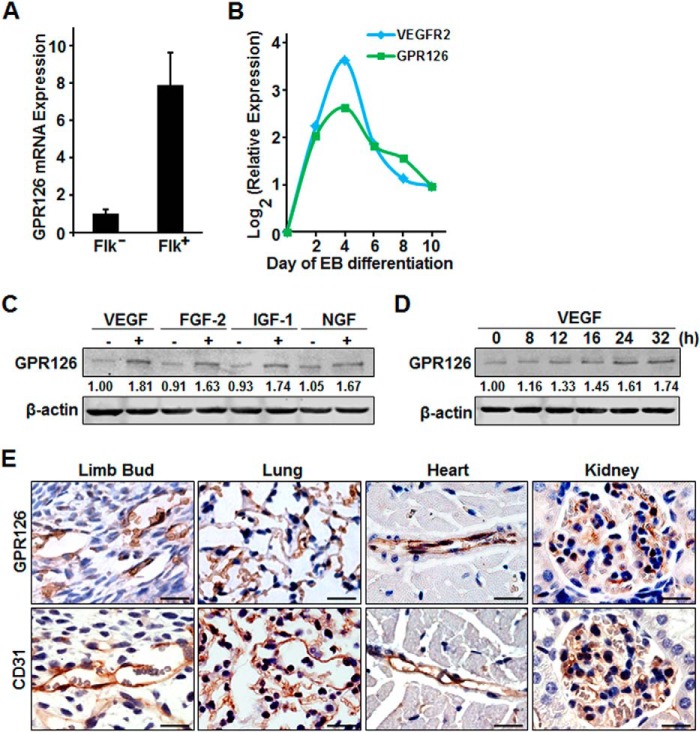
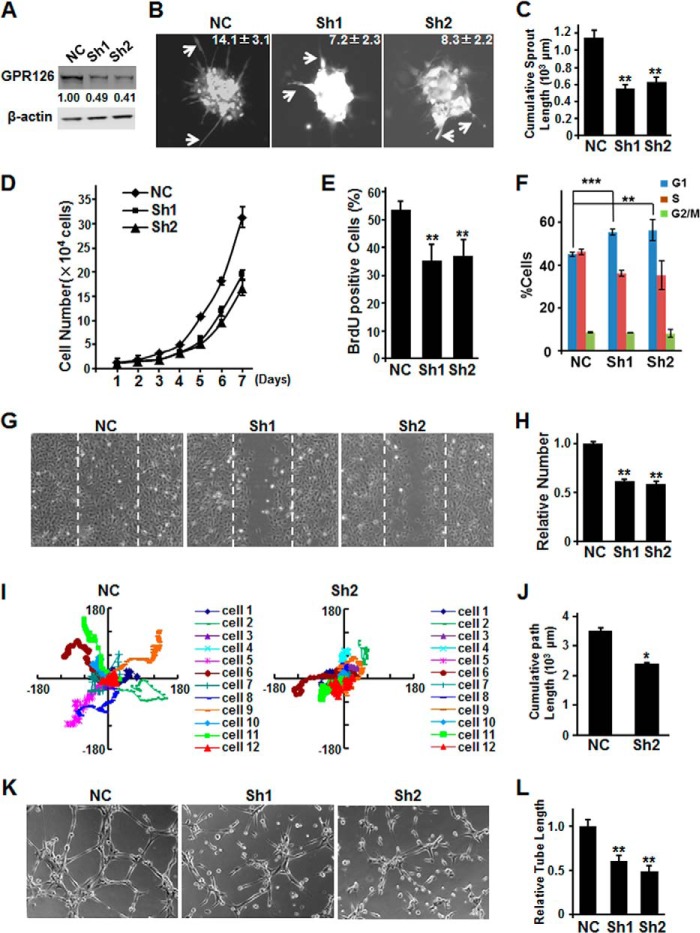
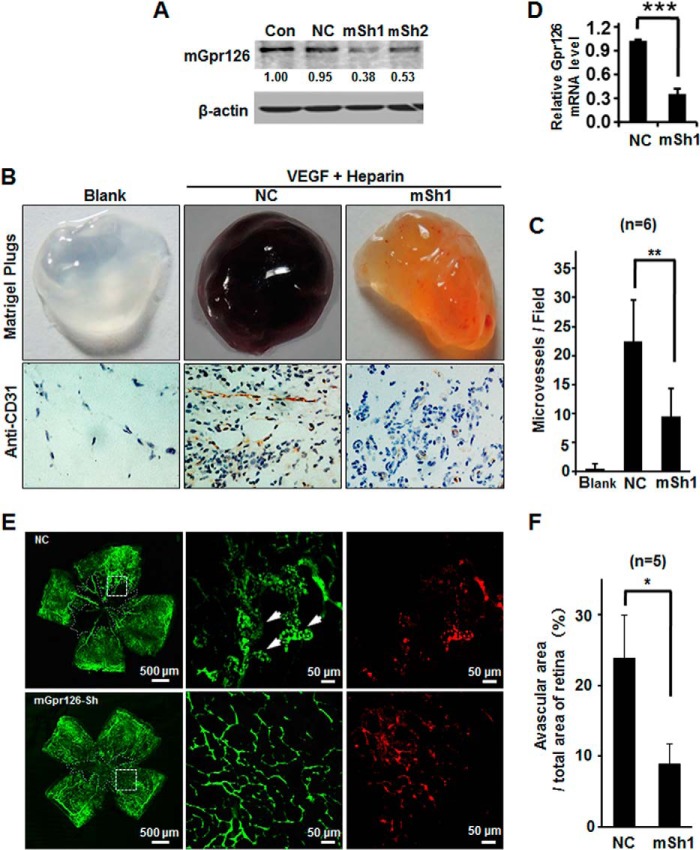
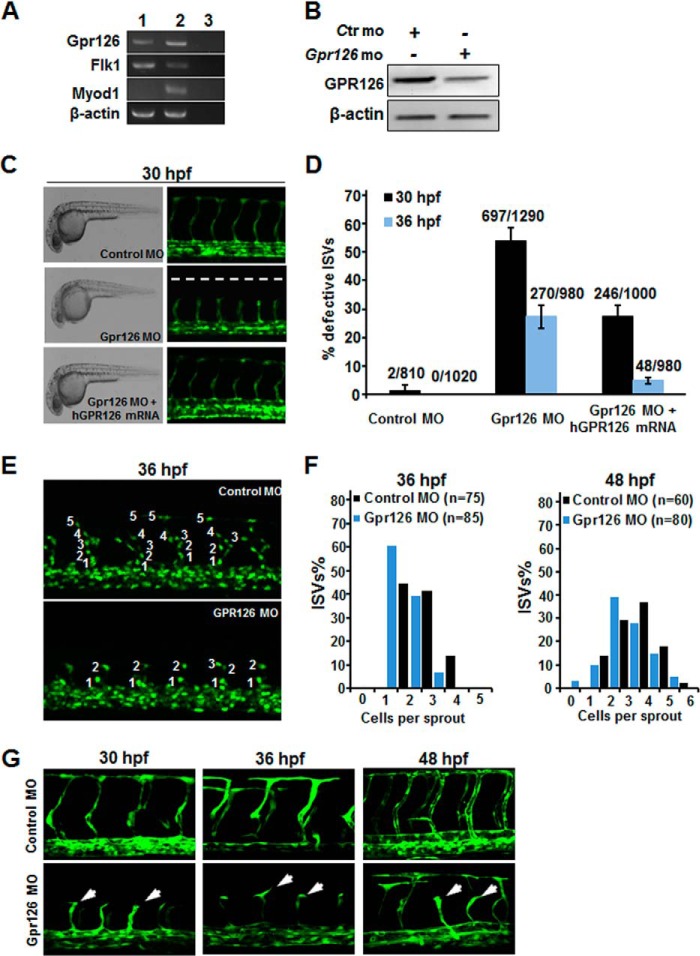
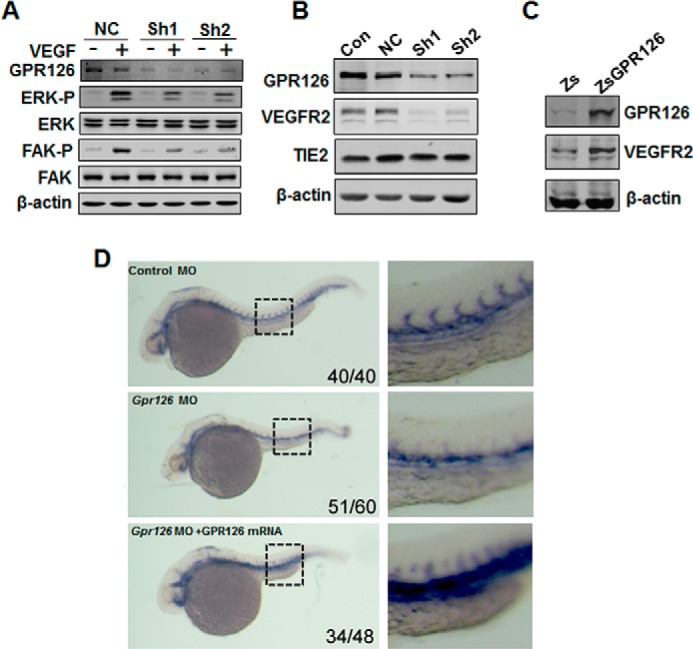
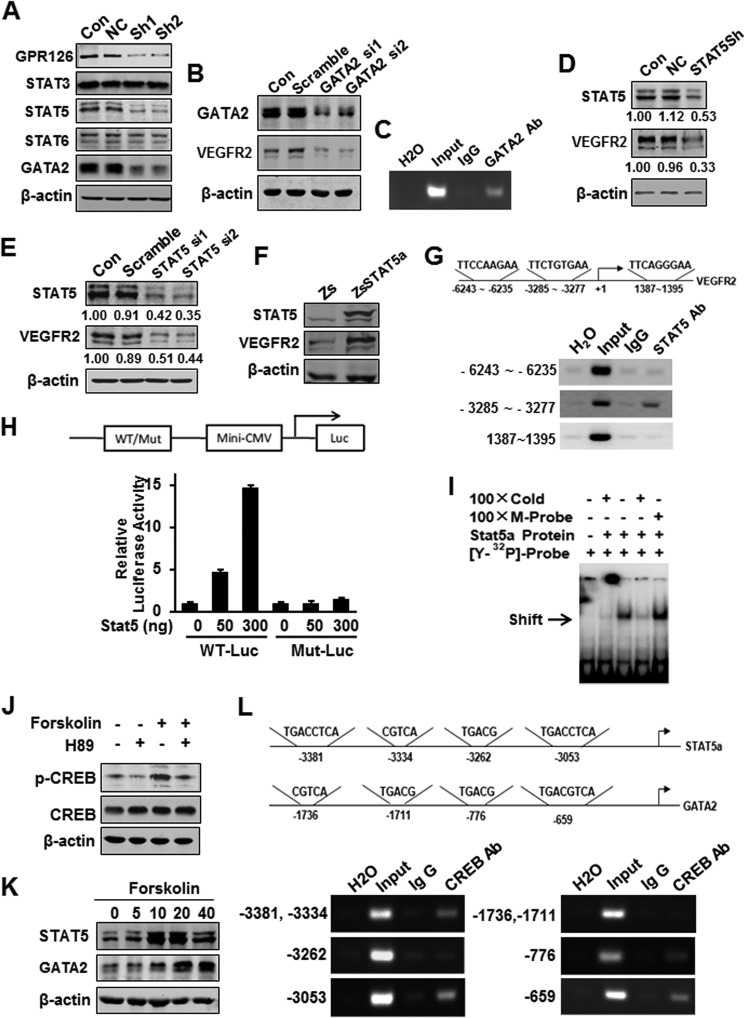
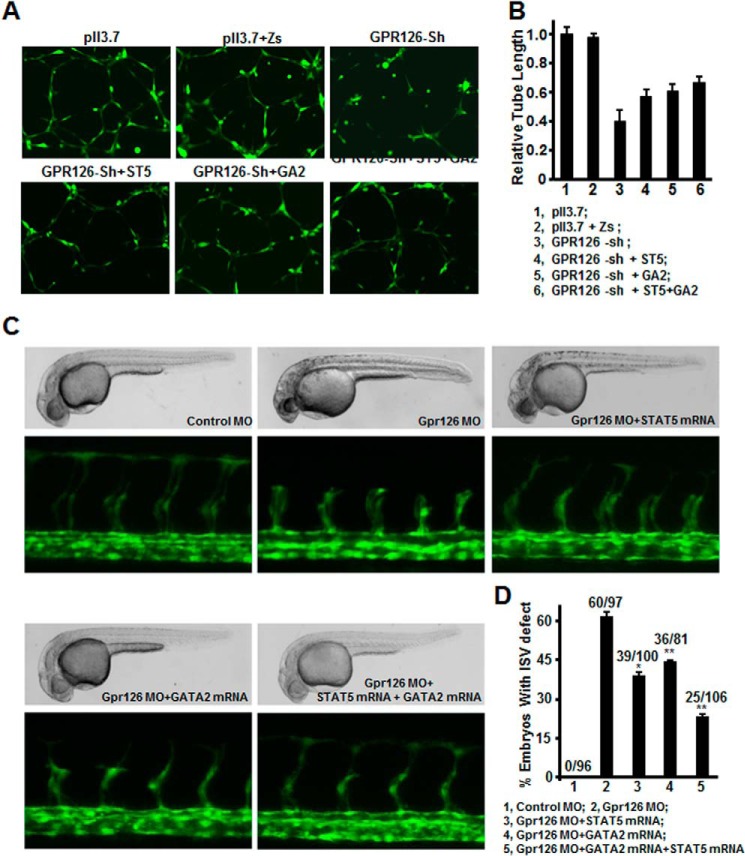
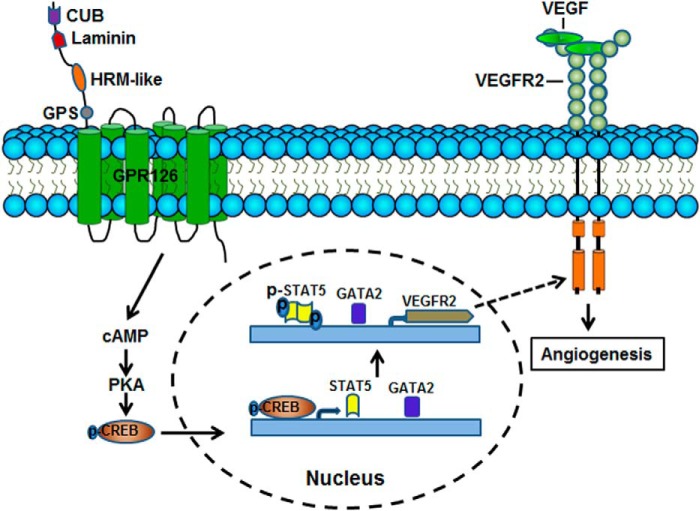
Angiogenesis, the formation of new blood vessels from pre-existing ones, is essential for development, wound healing, and tumor progression. The VEGF pathway plays irreplaceable roles during angiogenesis, but how other signals cross-talk with and modulate VEGF cascades is not clearly elucidated. Here, we identified that Gpr126, an endothelial cell-enriched gene, plays an important role in angiogenesis by regulating endothelial cell proliferation, migration, and tube formation. Knockdown of Gpr126 in the mouse retina resulted in the inhibition of hypoxia-induced angiogenesis. Interference of Gpr126 expression in zebrafish embryos led to defects in intersegmental vessel formation. Finally, we identified that GPR126 regulated the expression of VEGFR2 by targeting STAT5 and GATA2 through the cAMP-PKA-cAMP-response element-binding protein signaling pathway during angiogenesis. Our findings illustrate that GPR126 modulates both physiological and pathological angiogenesis through VEGF signaling, providing a potential target for the treatment of angiogenesis-related diseases.

Keywords: Angiogenesis; Endothelial Cell; G Protein-coupled Receptor (GPCR); Protein Kinase A (PKA); VEGFR2; Vascular Endothelial Growth Factor (VEGF).


Figures

FIGURE 1.
FIGURE 1.
Gpr126 is highly enriched in endothelial cells and is induced by pro-angiogenic growth factors in HMEC-1. A, Gpr126 expression is highly enriched in Flk1 (Vegfr2)-positive (Flk1+) ES cells. Gpr126 mRNA was detected by qRT-PCR in sorted Flk1-positive (Flk1+) and Flk1-negative (Flk1) ES cells at day 4 in an EB differentiation model. B, dynamic expression pattern of Gpr126 and Vegfr2 during ES cell differentiation. Gpr126 and Vegfr2 mRNA changes were monitored by qRT-PCR during differentiation of ES cells in an EB model. Expression was normalized to β-actin. C, regulation of GPR126 by different pro-angiogenic growth factors in HMEC-1 cells. The protein levels of GPR126 were detected with Western blot analysis in HMEC-1 cells treated with (+) or without (−) VEGF (50 ng/ml), FGF-2 (50 ng/ml), IGF-1 (50 ng/ml), and NGF (50 ng/ml) for 24 h. The numbers show the relative protein level of GPR126. D, protein levels of GPR126 were measured by Western blotting in HMEC-1 cells induced by VEGF (50 ng/ml) at the indicated time points. The numbers show the relative protein level of GPR126. E, expression of Gpr126 in different tissues using specific anti-Gpr126 antibody. Immunohistochemistry images of anti-Gpr126 (upper panel) and anti-CD31 (lower panel) antibodies in mouse limb buds (E15.5 embryos), lung, heart, and kidney are as indicated. Scale bar, 50 μm.
FIGURE 2.
FIGURE 2.
Knockdown of Gpr126 impairs angiogenesis in vitro. A–C, knockdown of GPR126 impaired endothelial sprout formation. RNAi efficiency was determined by Western blotting in HMEC-1 cells. The numbers show the relative protein level of GPR126 compared with the negative control (NC) (A). Three-dimensional in vitro angiogenesis assays with collagen gel-embedded spheroids of vector control (NC) or GPR126 shRNAs (Sh1 and Sh2)-infected HMEC-1 cells. Representative micrographs and the quantification of the sprout number of each spheroid are shown (B). A statistical summary of cumulative sprout length of nine spheroids of each group are shown (C). D–F, regulation of endothelial cell proliferation by GPR126. D, vector control (NC) or GPR126 shRNA (Sh1 and Sh2)-infected HMEC-1 cells were seeded in 12-well plates and grown for 7 days. The cell number was counted every day. Knockdown of GPR126 affects BrdU incorporation and cell cycle progression in HMEC-1 cells. HMEC-1 cells were infected with vector control (NC) and GPR126 shRNAs (Sh1 and Sh2), respectively. BrdU was supplemented into culture medium for 10 h, and then the cells were fixed for immunofluorescence with anti-BrdU-specific antibody. The percentage of BrdU-positive cells was calculated (E). Control or GPR126 shRNA-infected HMEC-1 cells were subjected to flow cytometry for cell cycle analysis (F). Error bars represent S.E.; **, p < 0.01; ***, p < 0.001. G and H, knockdown of GPR126 inhibited HMEC-1 cell migration in wound healing assays. Dashed lines indicate the edge of the “wound” right after scratch (G). Relative cell numbers migrated to the “wound” were presented (H). I and J, GPR126 regulates the migration of endothelial cells. The migration tracks of 12 empty vector-infected (NC) or 12 GPR126 knockdown (Sh2) HMEC-1 cells were plotted after normalizing the start point to x = 0 and y = 0 (I). The coordinate of each cell from the photo sequences were determined by Image-Pro Plus (version 6.0.0.260). The column diagram showed a cumulative path length of 12 control and 12 GPR126-knockdown cells (J). K and L, capillary tube formation of endothelial cells infected with vector control (NC) or GPR126 shRNAs (Sh1 and Sh2) were seeded onto Matrigel. After 4–6 h, cells were fixed, and tubular structure was quantified by calculating the tube length of high power fields (×200). All error bars represent S.E. *, p < 0.05; **, p < 0.01 compared with control.
FIGURE 3.
FIGURE 3.
Knockdown of Gpr126 suppresses angiogenesis in Matrigel plugs and hypoxia-induced retinal neovascularization. A, RNAi efficiency was determined by Western blotting in NIH3T3 cells. B–D, effect of Gpr126 knockdown by mSh1 (mSh) on angiogenesis in Matrigel plugs. Gross photographs of typical plugs are shown, and Matrigel plugs were sectioned and stained with anti-CD31 antibody to indicate neovascularization (B). Quantification of vessel number per high power field (×200) is shown in C. The mRNA levels of Gpr126 in the cells extracted from indicated Matrigel plugs were detected by qRT-PCR (D). E, knockdown of Gpr126 in mouse retina affects hypoxia-induced retinal angiogenesis. Control or Gpr126 lentiviral shRNA was delivered through intravitreal injection into neonatal mice that were then subjected to OIR model. After perfusion with FITC-dextran (green), retinal flat mounts were prepared and analyzed by confocal microscopy. The red fluorescence indicates the lentiviral infection efficiency. Arrows show pathological neovascular tufts. Avascular areas are surrounded by white lines. F, quantification of relative ratio of avascular area versus total retinal area of each retina was determined as described under “Experimental Procedures.” ImageJ software was used for quantification of avascular area. Error bars represent S.E. *, p < 0.05 compared with control.
FIGURE 4.
FIGURE 4.
Interference of Gpr126 expression impairs angiogenesis and vessel formation during zebrafish embryogenesis. A, Tg(flk1:EGFP) embryos at 24 hpf were dechorionated followed by removing yolk. Cells prepared from embryos by digestion using trypsin were filtered and sorted. RNA was extracted from in-isolated EGFP-positive cells, and RT-PCR was performed using gene-specific primers. Lane 1, sorted EGFP-positive cells; lane 2, the whole mount embryos; lane 3, no DNA template. B, RNAi efficiency of the morpholinos targeting zebrafish Gpr126 was detected by immunoblotting. Ctr MO, control morpholino; Gpr126 MO, morpholino against GPR126. C, lateral views of Tg(fli1:EGFP)y1 zebrafish embryos injected with indicated MOs or mRNA. Bright field images revealed no major changes in gross morphology (C, left panel). Confocal images of fli1:EGFP embryos of each treatment are shown (C, right panel). D, percentage of defective ISVs in each group at 30 and 36 hpf. 10 ISVs per embryo were quantified. Numbers above the column represent the number of defective ISVs/the number of total ISVs. E and F, confocal images of Tg(fli1:nEGFP)y7 embryos injected with MOs at 36 hpf. Endothelial cell number of ISVs was labeled. F, quantification of ISV endothelial cell number in Control MO (Ctr mo) and GPR126 MO-injected embryos at 36 (left panel) and 48 hpf (right panel). G, Gpr126 regulates the ISV tip cell polarization and migration. Images from high resolution two-photon laser scanning microscopy showed the difference of the ISV tip cell polarization and migration between the control MO and Gpr126 MO-injected embryos at 30, 36, or 48 hpf. The ISV tip cells of the Gpr126 morphants were unpolarized and arrested at the horizontal myoseptum (bottom arrows). Lateral views, anterior is to the left, and dorsal is up.
FIGURE 5.
FIGURE 5.
GPR126 regulates VEGFR2 expression in vitro and in vivo. A, regulation of ERK and FAK phosphorylation by GPR126. Immunoblot of lysates from HMEC-1 cells infected with control or GPR126 shRNAs (Sh1 and Sh2) in the presence (+) or absence of VEGF (−). VEGF-induced ERK and FAK activation in GPR126 shRNA-infected HMEC-1 cells (Sh1 and Sh2) was inhibited compared with the vector control (NC). B, down-regulation of VEGFR2 in GPR126-deficient cells. Western blot analysis showed that the protein level of VEGFR2, but not that of TIE2, decreased in GPR126 shRNAs (Sh1 and Sh2)-infected HMEC-1 cells compared with noninfected (Con) or vector control cells (NC). C, forced expression of GPR126 in HMEC-1 cells increased VEGFR2 expression. Zs, control vector; ZsGPR126, GPR126 overexpression construct. D, knockdown of zebrafish Gpr126 decreased Flk1 (Vegfr2) mRNA expression during embryogenesis. Whole mount in situ hybridization was performed with Flk1-specific probe. Flk1 mRNA expression was detected in zebrafish embryos with indicated treatment. Control MO (upper panel), Gpr126 MO (middle panel), or Gpr126 MO with human GPR126 mRNA coinjection (lower panel). Higher magnifications are shown (right panel). The number in the right bottom corner of each panel represents the number of representative phenotype as shown/the number of total embryos conducted with injection.
FIGURE 6.
FIGURE 6.
GPR126 stimulates VEGFR2 transcription via STAT5 and GATA2. A, effects of GPR126 on the expression of transcription factors involved in angiogenesis. Protein levels were analyzed by immunoblot using specific antibodies in HMEC-1 cells (Con) and in cells infected with vector control (NC) or GPR126 shRNA (Sh1 and Sh2). B and C, regulation of VEGFR2 expression by GATA2. VEGFR2 protein level was analyzed by immunoblot in HMEC-1 cells (Con), cells transfected with control siRNA (Scramble), or GATA2 siRNA (GATA2 si1 and GATA2 si2) (B). Chromatin of HMEC-1 cells was immunoprecipitated with anti-GATA2 antibody or IgG control. The extracted DNA was used for PCR amplifications with VEGFR2 promoter-specific primers (C). D–F, regulation of VEGFR2 expression by STAT5. VEGFR2 protein level was analyzed by immunoblot in HMEC-1 cells (Con), cells transfected with control shRNA (NC), or STAT5 shRNA vector (STAT5Sh) (D), or control siRNA (Scramble), and STAT5 siRNA (ST5 si1 and ST5 si2) (E), respectively. F, forced expression of STAT5 increased VEGFR2 expression in HMEC-1 cells. Zs, control vector; ZsSTAT5, STAT5 overexpression vector. G, chromatin of HMEC-1 cells was immunoprecipitated with anti-STAT5 antibody or IgG control. The extracted DNA was used for PCR amplifications with VEGFR2 promoter-specific primers. STAT5 strongly bound to the predicted site (−3285 to −3277, TTCTGTGAA) in the VEGFR2 promoter. The assays were conducted at least three times. H, wild type (WT-Luc) or STAT5-binding site mutant (Mut-Luc) VEGFR2 promoter luciferase reporter was transfected with increasing doses of STAT5 expression plasmid, and the luciferase activity was determined. I, in vitro translated STAT5 protein was incubated with hot STAT5-binding element derived from VEGFR2 for EMSAs. Cold WT (Cold) or mutant STAT5-binding site (M-probe) probes were subjected for competition. J–L, GPR126 regulated STAT5 and GATA2 expression through cAMP-activated PKA-CREB pathway. Phospho-CREB (Ser-133) was activated in HMEC-1 cell with forskolin (20 μm) stimulation and inhibited with H-89 (10 μm) treatment (J). K, forskolin increased the STAT5 and GATA2 protein levels in a dose-dependent manner in HMEC-1 cells. L, ChIP assays of the CRE site in the STAT5 and GATA2 promoter. Top panel showed the predicted conserved CRE site or half-CRE site in the STAT5 promoter. Middle panel showed that of the GATA2 promoter. After immunoprecipitation of the cross-linked complexes, DNA was recovered by phenol/chloroform extraction. Then the DNA were amplified by PCR using indicated primers. The PCR bands in bottom panel showed the DNA fragment precipitated by anti-CREB antibody in the promoter region of STAT5 (bottom left) and GATA2 (bottom right), respectively.
FIGURE 7.
FIGURE 7.
STAT5 and GATA2 restored the angiogenic activity of ECs attenuated by GPR126 knockdown. A, forced expression of STAT5 and/or GATA2 in GPR126 knockdown HMEC-1 cells restored two-dimensional tube formation on Matrigels. pll3.7, control vector of shRNA; Zs, control vector for overexpression; GPR126-Sh, GPR126 shRNA; ST5, STAT5 overexpression; GA2, GATA2 overexpression. B, statistical summary of relative tube length of each group in A. C, restoration of angiogenic activity of endothelial cells in zebrafish embryos. Bright field images showed the morphology of 30 hpf Tg(fli1:EGFP)y1 zebrafish embryos in each injection treatment. Confocal fluorescence images showed ISVs sprouting of Tg(fli1:EGFP)y1 embryos of each treatment. D, statistical summary of percentage of embryos with ISV defect in each group in C. The numbers above the column represent the number of embryos with ISV defect/the number of embryos analyzed totally.
FIGURE 8.
FIGURE 8.
Diagram of putative mechanisms of GPR126 function in endothelial cells. GPR126 stimulates STAT5 and GATA2 transcriptional activities through cAMP-activated PKA-CREB pathway. The activated STAT5 and GATA2 independently bind to the VEGFR2 promoter and activate its expression. Up-regulation of VEGFR2 protein levels amplifies downstream angiogenic cascades, such as activation of FAK and ERK. Thus, GPR126 promotes VEGF signaling and angiogenesis by modulating VEGFR2 expression through STAT5 and GATA2 in endothelial cells.

Similar articles

Cited by

References

    1. De Val S., Black B. L. (2009) Transcriptional control of endothelial cell development. Dev. Cell 16, 180–195 - PMC - PubMed
    1. Schmidt A., Brixius K., Bloch W. (2007) Endothelial precursor cell migration during vasculogenesis. Circ. Res. 101, 125–136 - PubMed
    1. Pardanaud L., Luton D., Prigent M., Bourcheix L. M., Catala M., Dieterlen-Lievre F. (1996) Two distinct endothelial lineages in ontogeny, one of them related to hemopoiesis. Development 122, 1363–1371 - PubMed
    1. Pober J. S., Sessa W. C. (2007) Evolving functions of endothelial cells in inflammation. Nat. Rev. Immunol. 7, 803–815 - PubMed
    1. Yancopoulos G. D., Davis S., Gale N. W., Rudge J. S., Wiegand S. J., Holash J. (2000) Vascular-specific growth factors and blood vessel formation. Nature 407, 242–248 - PubMed

Publication types

MeSH terms