. 2014 Oct 23;124(17):2647-56.
doi: 10.1182/blood-2013-10-534313. Epub 2014 Sep 12.

Epigenetic control of dendritic cell development and fate determination of common myeloid progenitor by Mysm1

Affiliations

Epigenetic control of dendritic cell development and fate determination of common myeloid progenitor by Mysm1

Haejung Won et al. Blood. .

Abstract

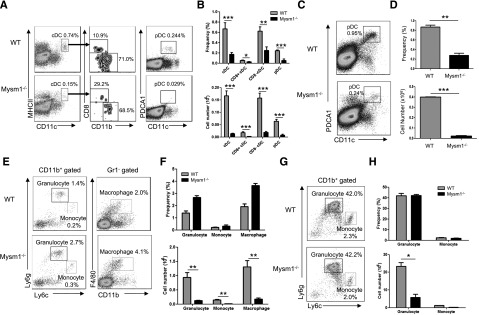
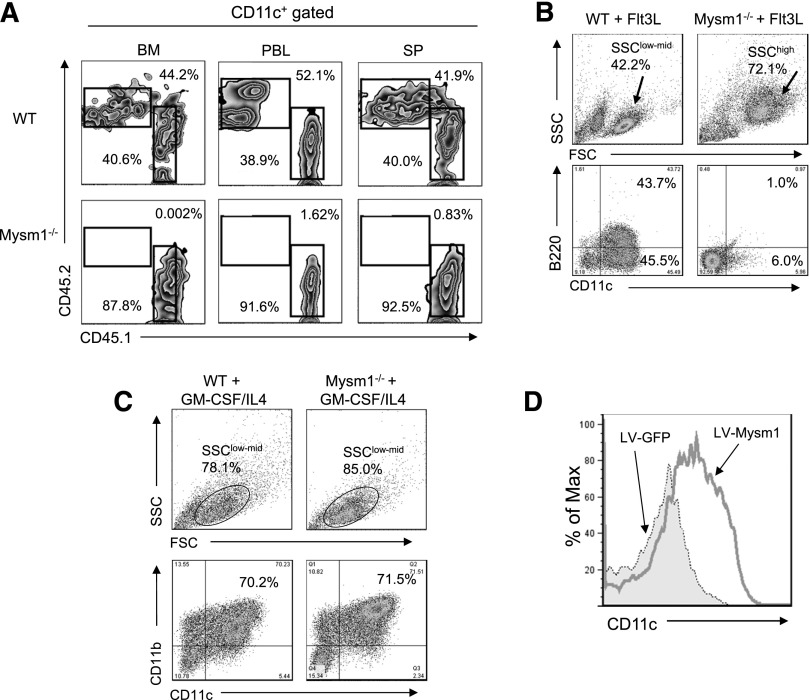
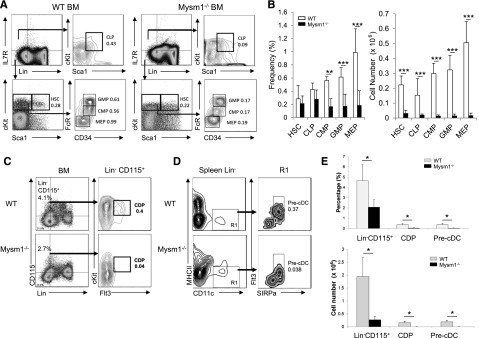
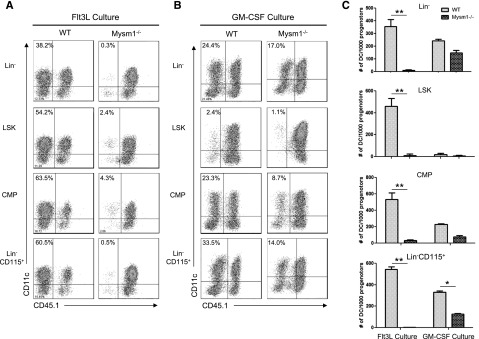
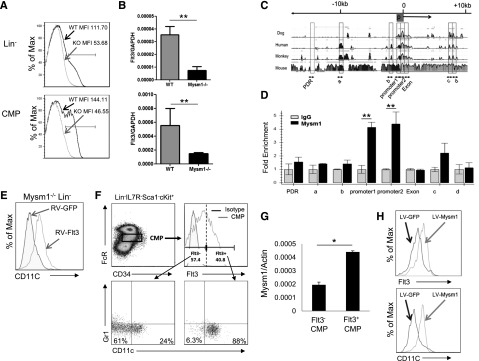
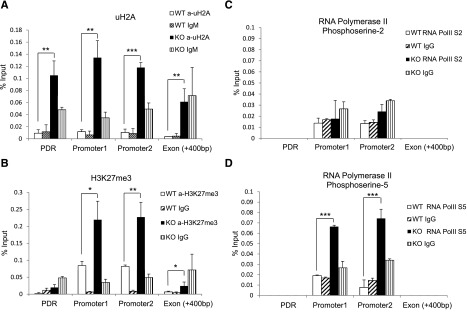
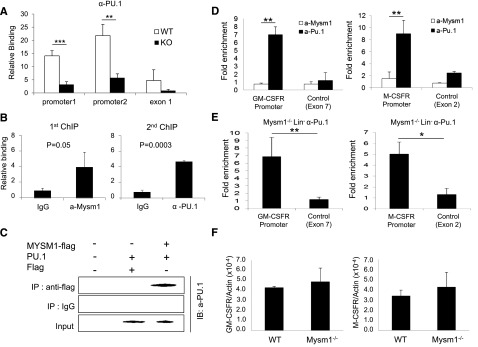
The mechanisms controlling the development of dendritic cells (DCs) remain incompletely understood. Using an Mysm1 knockout (Mysm1(-/-)) mouse model, we identified the histone H2A deubiquitinase Mysm1, as a critical regulator in DC differentiation. Mysm1(-/-) mice showed a global reduction of DCs in lymphoid organs, whereas development of granulocytes and macrophages were not severely affected. Hematopoietic progenitors and DC precursors were significantly decreased in Mysm1(-/-) mice and defective in Fms-like tyrosine kinase-3(Flt3) ligand-induced, but not in granulocyte macrophage-colony-stimulating factor (GM-CSF)-induced DC differentiation in vitro. Molecular studies demonstrated that the developmental defect of DCs from common myeloid progenitor (CMP) in Mysm1(-/-) mice is associated with decreased Flt3 expression and that Mysm1 derepresses transcription of the Flt3 gene by directing histone modifications at the Flt3 promoter region. Two molecular mechanisms were found to be responsible for the selective role of Mysm1 in lineage determination of DCs from CMPs: the selective expression of Mysm1 in a subset of CMPs and the different requirement of Mysm1 for PU.1 recruitment to the Flt3 locus vs GM-CSF-α and macrophage-colony-stimulating factor receptor loci. In conclusion, this study reveals an essential role of Mysm1 in epigenetic regulation of Flt3 transcription and DC development, and it provides a novel mechanism for lineage determination from CMP.


Figures

Figure 1
Figure 1
Mysm1 is required for DC development. (A-H) Spleens and BM from 4- to 6-week-old WT or Mysm1−/− mice were analyzed by FACS for the indicated cell populations (n = 4). (A) FACS analyses of splenic cDCs (CD11chighMHCII+) and the subsets: CD8+ cDCs (CD11chighMHCII+CD8+CD11b), CD8 cDCs (CD11chighMHCII+CD8CD11b+), and splenic pDCs (CD11cintPDCA1+). (B) Frequency and cell numbers of splenic cDCs and pDCs from WT and Mysm1−/− mice. (C) FACS analyses of BM pDCs (CD11c+PDCA1+). (D) Frequency and cell numbers of pDCs from BM of WT and Mysm1−/− mice. (E) FACS analyses of splenic granulocytes (CD11b+Ly6g+Ly6clow), monocytes (CD11b+ Ly6gneg-lowLy6chigh), and macrophages (CD11b+Gr1F4/80+). (F) Frequency and cell numbers of each cell type. (G) FACS analyses of BM-derived granulocytes and monocytes. (H) Frequency and cell numbers of each cell type. The data were shown form 1 of 3 independent experiments. *P < .05; **P < .01; ***P < .001.
Figure 2
Figure 2
Intrinsic role of Mysm1 in DC development. (A) CD45.2+ (2 × 10⁶) WT or Mysm1−/− BM cells were transplanted into lethally irradiated CD45.1+ recipient mice at 1:1 ratios with CD45.1+ WT competitor cells (2 × 10⁶). CD45.2+ cell populations in recipients were determined by FACS at 3 weeks posttransplantation in BM, peripheral blood (PBL), and spleen (SP). The representative FACS data from 2 mice were shown. The experiments were repeated more than 3 times with similar results. (B) BM cells were harvested from the femurs and tibiae of Mysm1−/− and WT littermates and 2 × 10⁶ cells/mL and were then plated in a 6-well plate. For Flt3L-induced DC differentiation, BM cells were cultured for 8 days without disruption in DC culture media supplemented with 100 ng/mL Flt3L. Cells were harvested and analyzed via FACS for pDCs (CD11c+B220+) and cDCs (CD11c+B220-−). The experiments were repeated more than 3 times with similar results. (C) For GM-CSF-induced DC culture, BM cells were cultured for 5 days in DC culture media supplemented with 20 ng/mL GM-CSF and 20 ng/mL IL-4. Cells were harvested and analyzed via FACS for cDC (CD11c+CD11b+). (D) BM cells from Mysm1−/− mice were transduced with either lentivirus-expressing mouse Mysm1 (LV-Mysm1) or control lentivirus (LV-GFP) for 8 hours. Cells were washed and cultured in Flt3L (100 ng/mL) supplemented media for 8 days and CD11c+ DC differentiation was analyzed by FACS. All the experiments were repeated more than 3 times with similar results. SSC, side scatter.
Figure 3
Figure 3
Decrease in DC progenitors. BM cells and splenocytes were analyzed via FACS for the indicated DC progenitor populations. (A) Lineage markers, Sca1, cKit, CD34, and CD16/32 were used to analyze HSC, common lymphoid progenitor (CLP), megakaryocyte and erythrocyte progenitor (MEP), granulocyte macrophage progenitor (GMP), and CMP populations. (B) Frequency and cell numbers of the hematopoietic precursor subpopulations in whole BM compartment. (C) BM from WT or Mysm1−/− were analyzed for LinCD115+ and CDP (LinCD115+c-KitintFlt3+). (D) Splenocytes were analyzed for pre-cDC (CD11c+MHCIIsignal-regulatory protein alpha [SIRPα]+ Flt3+). (E) Frequency and cell numbers of LinCD115+, CDPs, and pre-cDCs in BM or spleen. Data presented are mean values (± standard error of the mean) (n = 4). The experiments were repeated more than 3 times with similar results. *P < .05; **P < .01; ***P < .001.
Figure 4
Figure 4
Mysm1−/− DC progenitors fail to differentiate into DC with Flt3L in vitro stimulation. DC progenitor cells LinLSKs (LinSca1+cKit+), LinCD115+, and CMPs (LinIL7RSca1c-Kit+CD34+CD16/32int) were isolated from WT or Mysm1−/− BM by FACS sorter and 10 000 progenitor cells were cultured with 1.5 × 10⁵ CD45.1 BM feeder cells in the presence of Flt3L (100 ng/mL) (A) or GM-CSF (20 ng/mL) and IL-4 (20 ng/mL) (B) in a 96-well plate for 8 days. Cells were harvested and analyzed by FACS for DC differentiation (CD11c+ CD45.1). (C) The number of DCs (CD11c+ CD45.1) generated from 1000 progenitors of each culture was calculated and presented as an average from 2 to 3 wells. The experiments were repeated 3 times with similar results. *P < .05; **P < .001.
Figure 5
Figure 5
Mysm1 drives CMP toward DC lineage specification by upregulating Flt3 expression. Expression of Flt3 in Lin BM cells and CMP population was analyzed by (A) FACS and (B) qPCR; the messenger RNA (mRNA) expression was normalized to glyceraldehyde 3-phosphate dehydrogenase messenger RNA amount. (C) Sequence alignment of dog, human, monkey, and mouse Flt3 genes; transcription start site (0); and promoter site (P). (D) ChIP assay analyzed recruitment of Mysm1 to Flt3 gene locus in WT Lin BM cells. The prepared chromatin was immunoprecipitated with either an anti-Mysm1 antibody or control IgG, and pulled-down DNA was eluted and subjected to qPCR using the primers designed from conserved region (boxed) among species. (E) Lin cells were sorted from Mysm1−/− BM and transduced with retrovirus-expressing GFP (RV-GFP) or Flt3 (RV-Flt3) for 12 hours. Cells were cultured in DC culture media supplemented with 100 ng/mL of Flt3L (at a density of 1 × 10⁵ cells/100 uL) for 8 days. FACS was used to analyze the differentiation of CD11c+ DCs. (F-H) Mysm1 drives CMPs to DC lineage specification. CMPs from WT BM was sorted and divided into 2 populations by Flt3 expression: Flt3 CMPs and Flt3+ CMPs. The sorted cells were cultured in Flt3L-supplemented media for 8 days and surface markers CD11c and Gr1 was used to analyze DC differentiation by FACS (F), and Mysm1 levels in these 2 populations were measured by qPCR (G). Flt3 CMP population was infected with lentivirus expressing either GFP or Mysm1, and was cultured in Flt3L-supplemented media for 8 days. Surface expression of CD11c and Flt3 was analyzed by FACS (H). *P < .05; **P < .01.
Figure 6
Figure 6
Altered histone modification and RNA polymerase activity at Flt3 locus in Mysm1−/− BM. ChIP assay analyzed BM Lin cells from WT or Mysm1−/− mice via (A) anti-uH2A, (B) anti-H3K27me3, (C) anti-phosphoserine-2 RNA polymerase, or (D) anti-phosphoserine-5 RNA polymerase II. The precipitated DNA was analyzed by qPCR with primers amplifying Flt3 promoter regions (promoter 1 and 2), promoter deprived region (control primer), and Flt3 exon 1 region. *P < .05; **P < .01; ***P < .001. PDR, promoter-deprived region.
Figure 7
Figure 7
Mysm1 mediates localization of PU.1 to the Flt3 locus, but not to the GM-CSF-α receptor and M-CSF receptor loci. (A) ChIP analyses of PU.1 recruitment in WT or Mysm1−/− BM Lin cells. The precipitated DNA was analyzed by qPCR via 2 sets of primers amplifying the Flt3 promoter region (promoter 1 and promoter 2) or the first exon (exon1) and normalized with IgG control. (B) Sequential 2-step ChIP analyses of Mysm1 and PU.1 recruitment to the Flt3 promoter in WT BM Lin progenitors. Chromatin was immunoprecipitated with anti-Mysm1 or IgG for the first ChIP. The pulled-down chromatin was eluted and reimmunoprecipitated with anti-Pu.1 or IgG for the second ChIP. The released DNA from the first and second ChIP were subjected to qPCR analysis using primers encompassing Flt3 promoter. Relative binding was defined by determining the ratio of immunoprecipitated DNA to that in the input sample. The ratios of the control IgG-immunoprecipitated DNA to that in the input samples were set as 1.0. (C) Coimmunoprecipitation assay of Mysm1 and PU1. pCMV-Pu.1 plasmid was cotransfected with either pCMV-Flag-Mysm1 or pCMV-Flag expression plasmid into HEK293T cells and cell lysates were incubated with anti-Flag antibody and immunoprecipitated proteins were analyzed by anti-PU.1 antibody via western blot analysis. (D) ChIP analysis of Mysm1 and PU.1 recruitment to GM-CSF-α receptor or M-CSF receptor gene loci in WT Lin cells. The signal was normalized to IgG control. (E) ChIP analysis of PU.1 recruitment to the promoter loci of GM-CSF-α receptor and M-CSF receptor. Lin cells were isolated from Mysm1−/− BM and chromatin was immunoprecipitated with anti-PU.1 or IgG. The pulled-down DNA was eluted and amplified by qPCR via primers spanning the promoter or exon regions of GM-CSF-α receptor and M−CSF receptor. The signal was normalized to IgG control. (F) The qPCR analyzing messenger RNA of GM-CSF-α receptor (GM-CSFR) and M-CSF receptor (M-CSFR) in WT and Mysm12/2 Lin2 cells. *P < .05; **P < .01; ***P < .001.

Similar articles

Cited by

References

    1. Schmid MA, Kingston D, Boddupalli S, Manz MG. Instructive cytokine signals in dendritic cell lineage commitment. Immunol Rev. 2010;234(1):32–44. - PubMed
    1. Ebner S, Ratzinger G, Krösbacher B, et al. Production of IL-12 by human monocyte-derived dendritic cells is optimal when the stimulus is given at the onset of maturation, and is further enhanced by IL-4. J Immunol. 2001;166(1):633–641. - PubMed
    1. Inaba K, Inaba M, Romani N, et al. Generation of large numbers of dendritic cells from mouse bone marrow cultures supplemented with granulocyte/macrophage colony-stimulating factor. J Exp Med. 1992;176(6):1693–1702. - PMC - PubMed
    1. Sallusto F, Lanzavecchia A. Efficient presentation of soluble antigen by cultured human dendritic cells is maintained by granulocyte/macrophage colony-stimulating factor plus interleukin 4 and downregulated by tumor necrosis factor alpha. J Exp Med. 1994;179(4):1109–1118. - PMC - PubMed
    1. Xu Y, Zhan Y, Lew AM, Naik SH, Kershaw MH. Differential development of murine dendritic cells by GM-CSF versus Flt3 ligand has implications for inflammation and trafficking. J Immunol. 2007;179(11):7577–7584. - PubMed

Publication types

MeSH terms

Substances