

Diet and exercise orthogonally alter the gut microbiome and reveal independent associations with anxiety and cognition
- PMID: 25217888
- PMCID: PMC4168696
- DOI: 10.1186/1750-1326-9-36
Diet and exercise orthogonally alter the gut microbiome and reveal independent associations with anxiety and cognition
Abstract
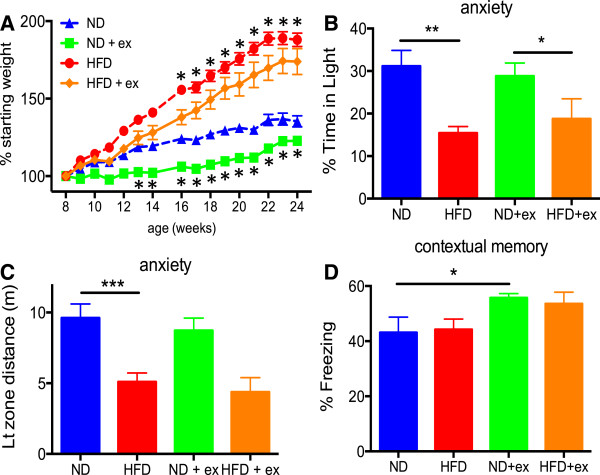
Background: The ingestion of a high-fat diet (HFD) and the resulting obese state can exert a multitude of stressors on the individual including anxiety and cognitive dysfunction. Though many studies have shown that exercise can alleviate the negative consequences of a HFD using metabolic readouts such as insulin and glucose, a paucity of well-controlled rodent studies have been published on HFD and exercise interactions with regard to behavioral outcomes. This is a critical issue since some individuals assume that HFD-induced behavioral problems such as anxiety and cognitive dysfunction can simply be exercised away. To investigate this, we analyzed mice fed a normal diet (ND), ND with exercise, HFD diet, or HFD with exercise.
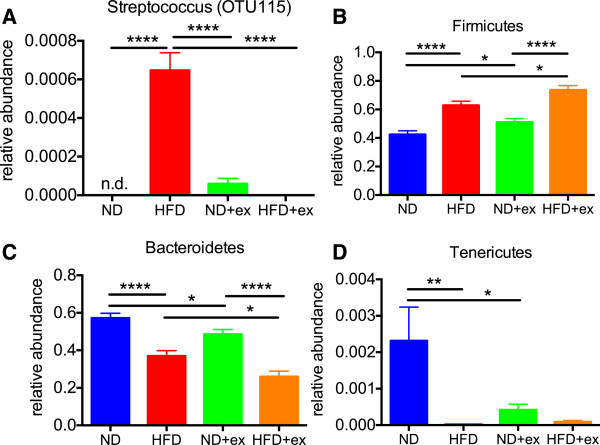
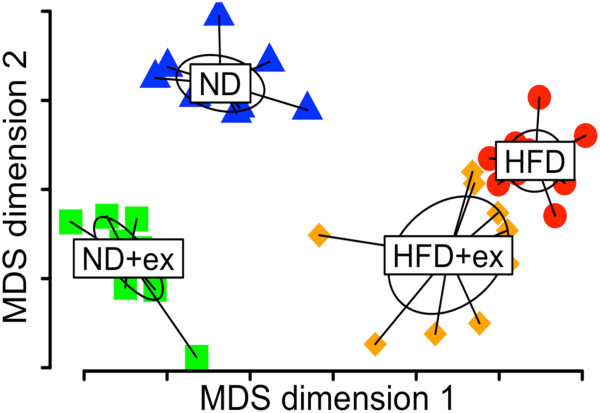
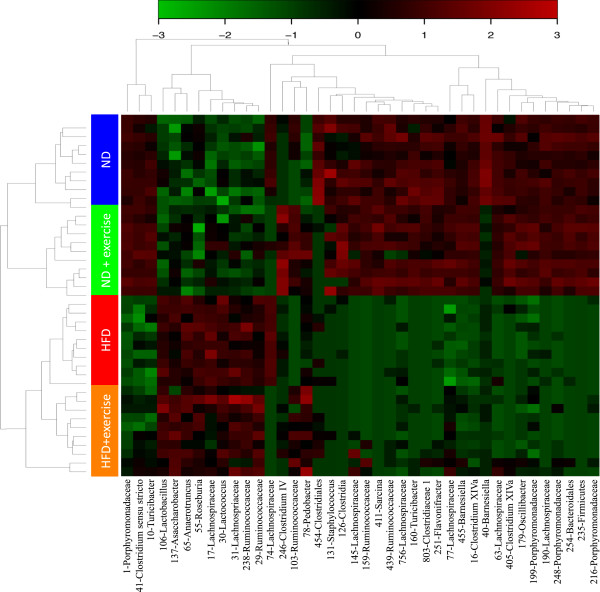
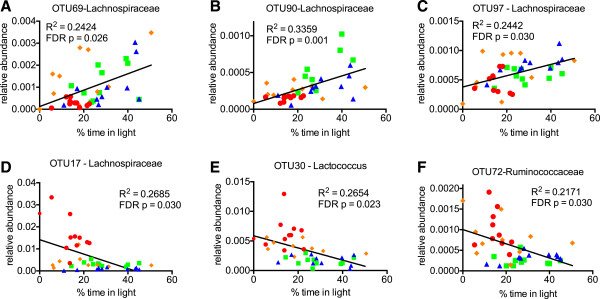
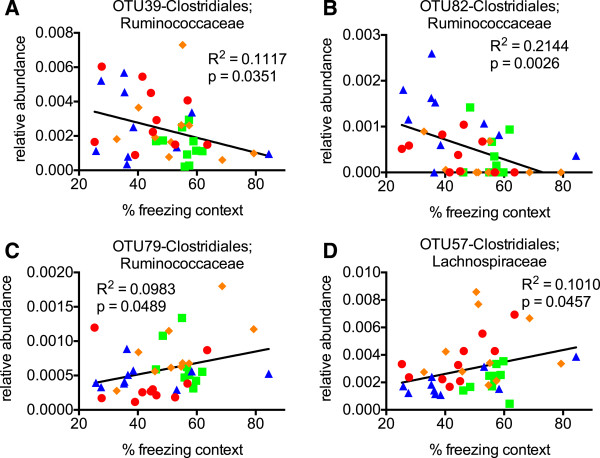
Results: We found that mice on a HFD had robust anxiety phenotypes but this was not rescued by exercise. Conversely, exercise increased cognitive abilities but this was not impacted by the HFD. Given the importance of the gut microbiome in shaping the host state, we used 16S rRNA hypervariable tag sequencing to profile our cohorts and found that HFD massively reshaped the gut microbial community in agreement with numerous published studies. However, exercise alone also caused massive shifts in the gut microbiome at nearly the same magnitude as diet but these changes were surprisingly orthogonal. Additionally, specific bacterial abundances were directly proportional to measures of anxiety or cognition.
Conclusions: Thus, behavioral domains and the gut microbiome are both impacted by diet and exercise but in unrelated ways. These data have important implications for obesity research aimed at modifications of the gut microbiome and suggest that specific gut microbes could be used as a biomarker for anxiety or cognition or perhaps even targeted for therapy.
Figures
Similar articles
-
High-intensity exercise training increases the diversity and metabolic capacity of the mouse distal gut microbiota during diet-induced obesity.Am J Physiol Endocrinol Metab. 2016 Jun 1;310(11):E982-93. doi: 10.1152/ajpendo.00537.2015. Epub 2016 Apr 26. Am J Physiol Endocrinol Metab. 2016. PMID: 27117007 Free PMC article.
-
Maternal exercise before and during pregnancy alleviates metabolic dysfunction associated with high-fat diet in pregnant mice, without significant changes in gut microbiota.Nutr Res. 2019 Sep;69:42-57. doi: 10.1016/j.nutres.2019.08.002. Epub 2019 Aug 8. Nutr Res. 2019. PMID: 31670066
-
Maternal obese-type gut microbiota differentially impact cognition, anxiety and compulsive behavior in male and female offspring in mice.PLoS One. 2017 Apr 25;12(4):e0175577. doi: 10.1371/journal.pone.0175577. eCollection 2017. PLoS One. 2017. PMID: 28441394 Free PMC article.
-
The Role of the Gut Microbiome in Diet and Exercise Effects on Cognition: A Review of the Intervention Literature.J Gerontol A Biol Sci Med Sci. 2023 Feb 24;78(2):195-205. doi: 10.1093/gerona/glac166. J Gerontol A Biol Sci Med Sci. 2023. PMID: 35977540 Free PMC article. Review.
-
The gut microbiome as a driver of individual variation in cognition and functional behaviour.Philos Trans R Soc Lond B Biol Sci. 2018 Sep 26;373(1756):20170286. doi: 10.1098/rstb.2017.0286. Philos Trans R Soc Lond B Biol Sci. 2018. PMID: 30104431 Free PMC article. Review.
Cited by
-
Reduced neurotrophic factor level is the early event before the functional neuronal deficiency in high-fat diet induced obese mice.Metab Brain Dis. 2017 Feb;32(1):247-257. doi: 10.1007/s11011-016-9905-z. Epub 2016 Sep 13. Metab Brain Dis. 2017. PMID: 27624843
-
The Role of the Gut Microbiome in Psychiatric Disorders.Microorganisms. 2022 Dec 9;10(12):2436. doi: 10.3390/microorganisms10122436. Microorganisms. 2022. PMID: 36557689 Free PMC article. Review.
-
Microbiota impacts on chronic inflammation and metabolic syndrome - related cognitive dysfunction.Rev Endocr Metab Disord. 2019 Dec;20(4):473-480. doi: 10.1007/s11154-019-09537-5. Rev Endocr Metab Disord. 2019. PMID: 31884557 Review.
-
Epigenetics in depression and gut-brain axis: A molecular crosstalk.Front Aging Neurosci. 2022 Dec 13;14:1048333. doi: 10.3389/fnagi.2022.1048333. eCollection 2022. Front Aging Neurosci. 2022. PMID: 36583185 Free PMC article. Review.
-
Microbiota from Exercise Mice Counteracts High-Fat High-Cholesterol Diet-Induced Cognitive Impairment in C57BL/6 Mice.Oxid Med Cell Longev. 2023 Jan 20;2023:2766250. doi: 10.1155/2023/2766250. eCollection 2023. Oxid Med Cell Longev. 2023. PMID: 36713033 Free PMC article.
References
Publication types
MeSH terms
Grants and funding
LinkOut - more resources
Full Text Sources
Other Literature Sources
Medical
