Case Reports
. 2014 Oct;46(10):1140-6.
doi: 10.1038/ng.3089. Epub 2014 Sep 14.

An activating NLRC4 inflammasome mutation causes autoinflammation with recurrent macrophage activation syndrome

Affiliations
Case Reports

An activating NLRC4 inflammasome mutation causes autoinflammation with recurrent macrophage activation syndrome

Scott W Canna et al. Nat Genet. 2014 Oct.

Abstract

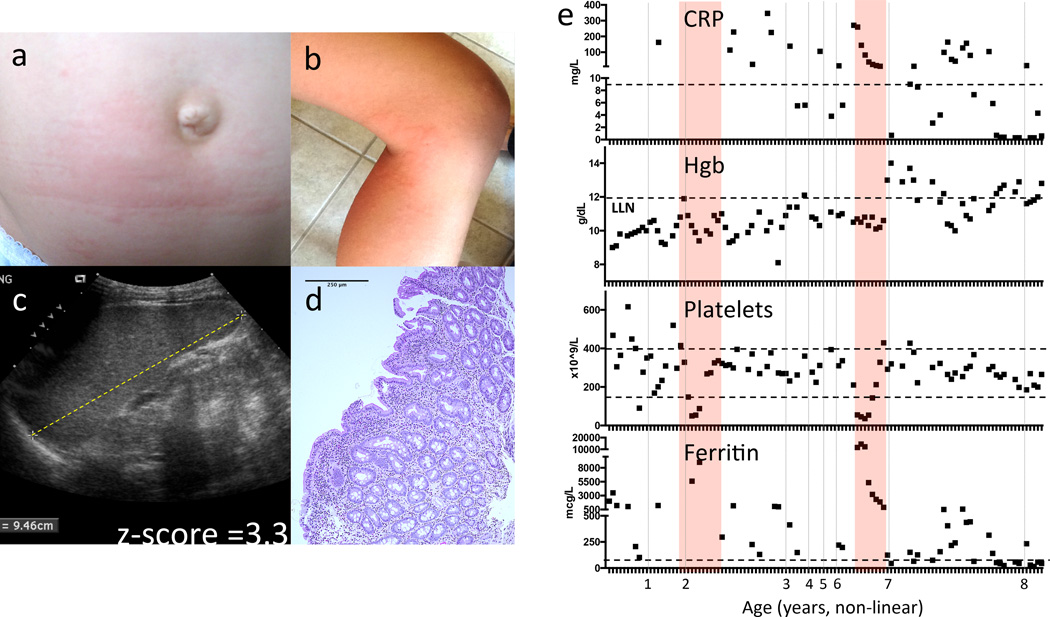
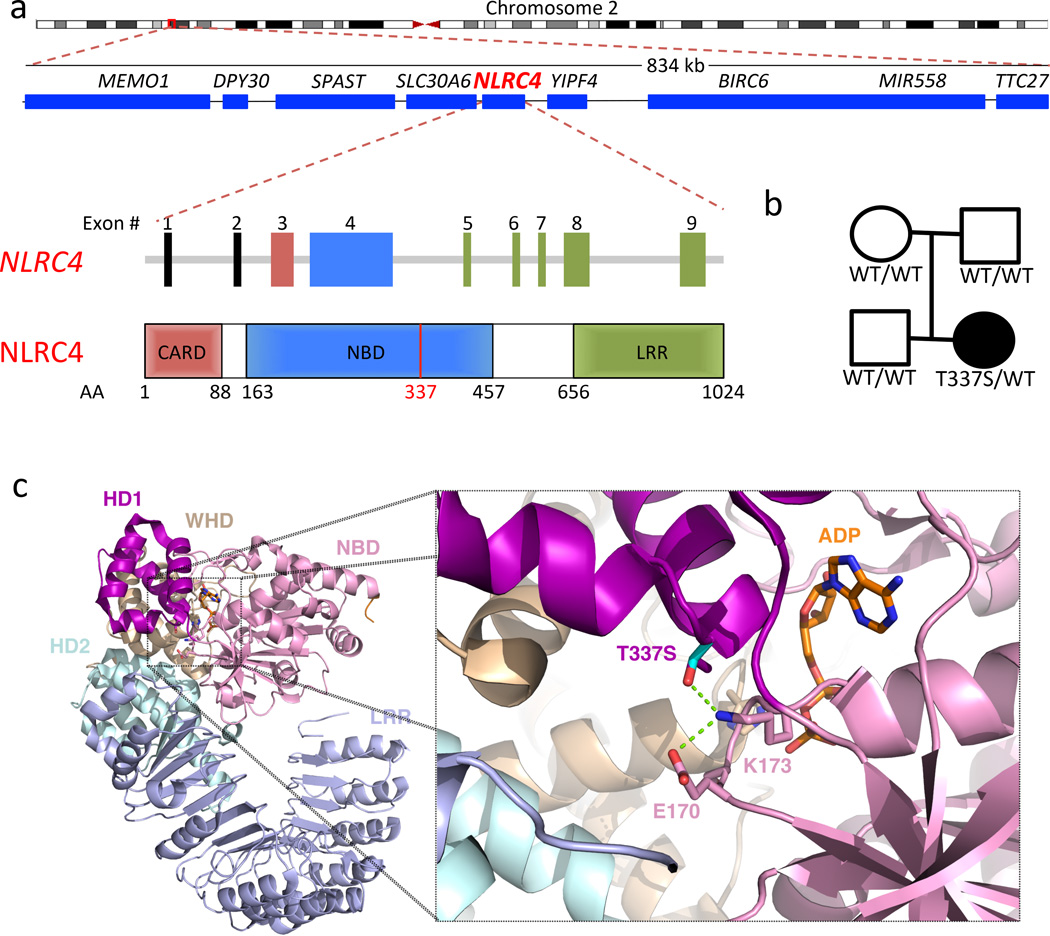
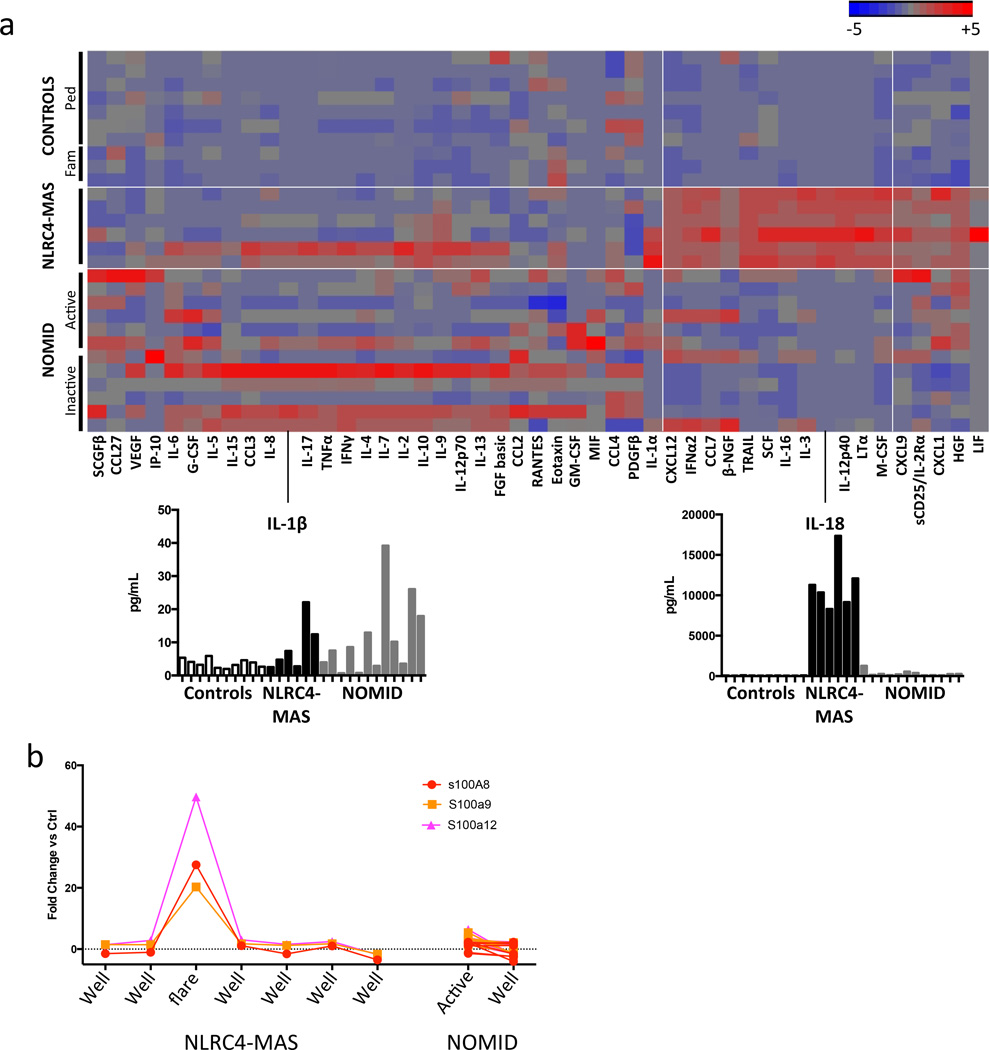
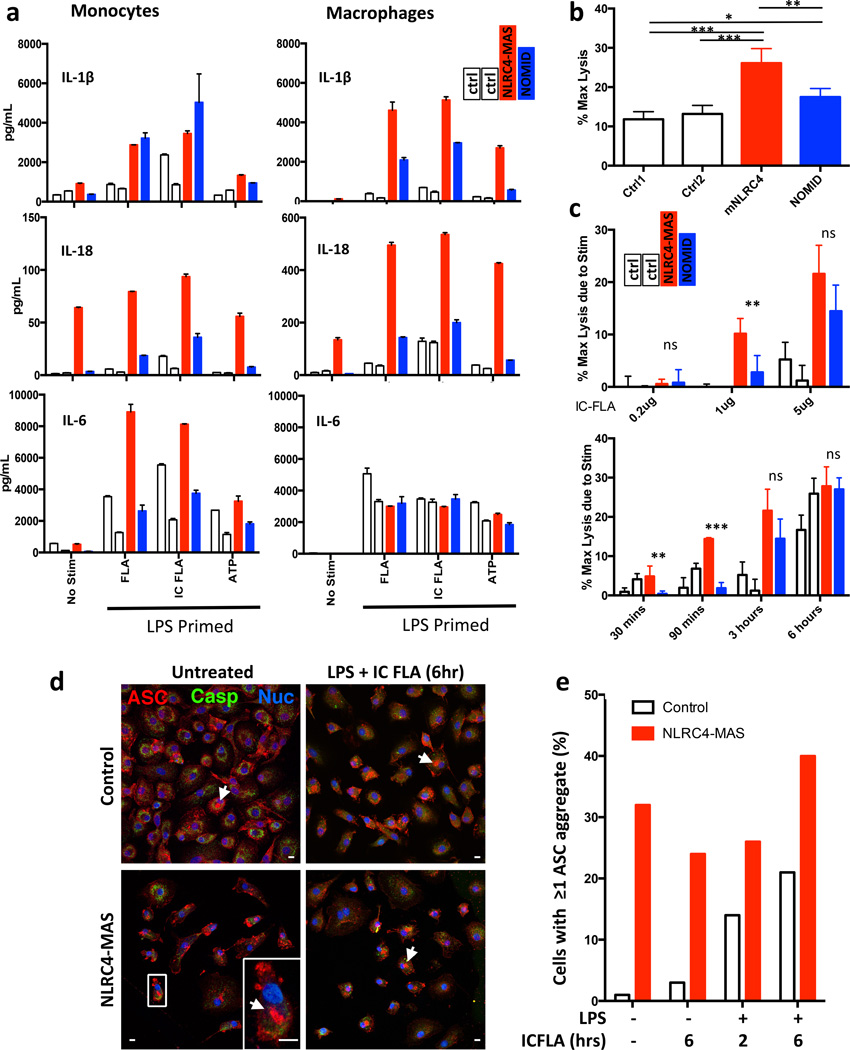
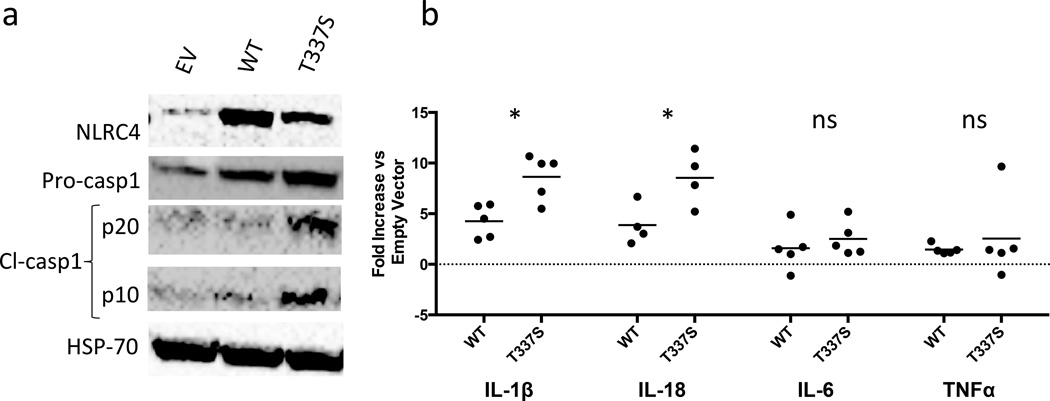
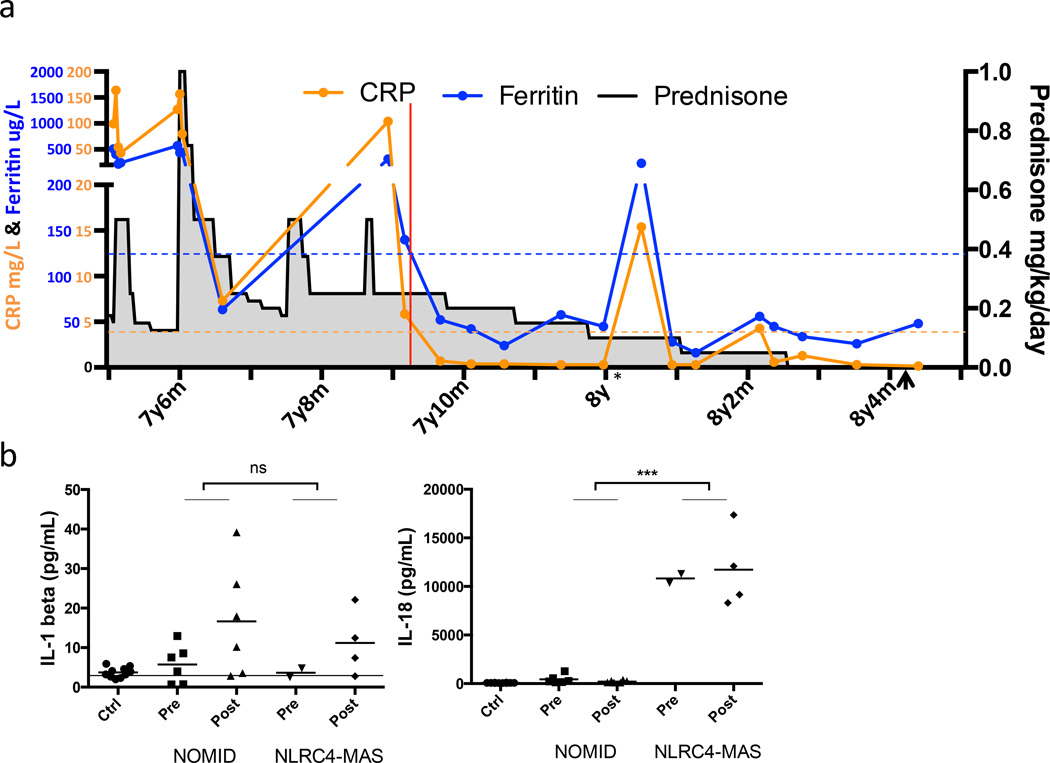
Inflammasomes are innate immune sensors that respond to pathogen- and damage-associated signals with caspase-1 activation, interleukin (IL)-1β and IL-18 secretion, and macrophage pyroptosis. The discovery that dominant gain-of-function mutations in NLRP3 cause the cryopyrin-associated periodic syndromes (CAPS) and trigger spontaneous inflammasome activation and IL-1β oversecretion led to successful treatment with IL-1-blocking agents. Herein we report a de novo missense mutation (c.1009A > T, encoding p.Thr337Ser) affecting the nucleotide-binding domain of the inflammasome component NLRC4 that causes early-onset recurrent fever flares and macrophage activation syndrome (MAS). Functional analyses demonstrated spontaneous inflammasome formation and production of the inflammasome-dependent cytokines IL-1β and IL-18, with the latter exceeding the levels seen in CAPS. The NLRC4 mutation caused constitutive caspase-1 cleavage in cells transduced with mutant NLRC4 and increased production of IL-18 in both patient-derived and mutant NLRC4-transduced macrophages. Thus, we describe a new monoallelic inflammasome defect that expands the monogenic autoinflammatory disease spectrum to include MAS and suggests new targets for therapy.


Figures

Figure 1
Figure 1. Severe flares in a patient with an NLRC4 mutation are consistent with Macrophage Activation Syndrome
(a) and (b) Evanescent, urticaria-like rashes with dermographism during flares. (c) Sonographic measurement of splenomegaly with longest dimension equivalent to an age-matched z-score of 3.32. (d) H&E micrograph of duodenal mucosal biopsy obtained at 18 months of age for vomiting and poor weight gain (20× magnification) showing non-specific mixed inflammatory infiltrate in the lamina propria and mild villous blunting. (e) Laboratory markers used to monitor Macrophage Activation Syndrome (MAS). The C-reactive Protein (CRP) is elevated, Hemoglobin (Hgb) is depressed, Platelet count is depressed, and serum ferritin rises during flares of MAS. All of the patient’s available laboratory data since birth are plotted (see also Supplementary Table 4). Pink bars indicate severe disease flares. Dashed lines indicate the normal ranges. The x-axis indicates the patient’s age in years (non-linear).
Figure 2
Figure 2. The NLRC4 mutation occurs de novo in a highly conserved area of the nucleotide binding domain
(a) Chromosomal location, adjacent genes, and exon structure of the NLRC4 gene and domain structure of the NLRC4 protein. AA = Amino Acid number. (b) Pedigree showing a de novo heterozygous mutation. The affected patient is denoted by a filled circle. (c) Location of amino acid substitution from threonine to serine at position 337 and R-group interactions with adjacent residues in the NBD which are predicted to be important for stabilizing ADP-binding (based on the crystal structure of the murine protein). NBD = Nucleotide Binding Domain, WHD = Winged-Helix Domain, HD = Helical Domain, LRR = Leucine Rich Repeat Domain. Green dashed line indicates predicted side chain interactions.
Figure 3
Figure 3. Peripheral blood signatures differentiate NLRC4-MAS from healthy controls and NOMID patients
(a) We performed multiplex cytokine analysis on serum from the NLRC4-MAS patient, healthy pediatric controls, the patient’s family, and NOMID patients. NLRC4-MAS patient samples were obtained at seven distinct timepoints over the course of 10 months. Paired NOMID samples were obtained from six patients during both clinically active and inactive disease. No serum sample during a clinical flare from the NLRC4-MAS patient was available for cytokine analysis. Values represent the mean of two technical replicates per sample. Hierarchical clustering was performed on cytokine values normalized to the mean value across all samples. The magnitude of serum IL-1β and IL-18 concentrations are shown below. Horizontal white lines separate disease groups and vertical white lines indicate cytokines that form the NLRC4-MAS signature. (b) Whole blood transcriptional analysis of S100A genes from the NLRC4-MAS patient and matched samples from seven NOMID patients during active or inactive disease. All patient values are expressed as Fold Change (FC) above or below the average expression in 5 healthy controls.
Figure 4
Figure 4. NLRC4-MAS monocytes and macrophages have increased inflammasome-related cytokine secretion, cell death, and ASC aggregate formation
(a) Monocytes and monocyte-derived macrophages from healthy controls (white bars) NLRC4-MAS (red) and NOMID patients (blue) were primed with LPS and stimulated with purified flagellin (FLA), liposomal flagellin (IC-FLA), or ATP. Secreted cytokines were measured by Luminex. Columns represent mean and SD of technical duplicates. Monocytes and macrophages represent matched samples. In LPS-primed cells, the addition of ATP did not alter cytokine production (data not shown). (b and c) LDH release as a marker of cell death, presented as the percentage of maximum lysis induced by 0.8% Triton X-100, was measured from macrophages after resting for six hours in serum-free medium alone (b) or after stimulation (c) with varying doses of IC-FLA for three hours (top) or with 5µg/mL IC-FLA for indicated time periods (bottom). Cell death assays were performed in biological quadruplicates. Mean and SD are representative of two independent experiments. Statistical comparisons were done by one-way ANOVA with Tukey’s Post-test. *p<0.05, **p<0.01, ***p<0.0001. Comparisons between NLRC4-MAS and NOMID are depicted. (d) and (e) Macrophages were stimulated as noted and imaged by confocal immunofluorescence microscopy. Red staining represents ASC, Green indicates caspase-1, and blue indicates nuclei. Representative images (d) with a detail of a representative ASC aggregate (arrowheads and inset) were taken and ASC aggregate formation (e) was quantitated. A 10µm scale bar is shown. All samples from NLRC4-MAS and NOMID patients (a through e) were obtained after IL-1 receptor antagonist treatment for at least 3 months.
Figure 5
Figure 5. Cells transduced with mutant NLRC4 exhibit spontaneous inflammasome activity
THP1 monocytes were stably transduced with empty retrovirus or retrovirus carrying WT or T337S-mutant NLRC4 and differentiated into macrophages per Online Methods. (a) Immunoblots of whole cell lysates from transduced THP1 cells. (b) cytokines were measured by ELISA in culture supernatants from WT or mutant NLRC4-transduced THP1-cells differentiated into macrophages with low-dose Phorbol 12-myristate 13-acetate (PMA) in technical triplicate per online methods. The values expressed represent the average concentration of the technical replicates for WT- or T337S-transduced macrophages divided by the average concentration of technical replicates for EV-transduced macrophages within the same experiment. Each point represents an individual experiment. *p<0.05 by unpaired student’s T-test.
Figure 6
Figure 6. IL-1 receptor antagonist treatment normalized markers of systemic inflammation and enabled cessation of steroids, while serum IL-18 remained elevated
(a) Chronologic depiction of C-reactive protein (CRP), serum ferritin, and prednisone dose before and after IL-1 receptor antagonist (anakinra) therapy. Red line indicates the start of anakinra treatment. Dashed lines represent the upper limits of normal. * Indicates a transient viral illness with temporary elevation of CRP and ferritin. Arrowhead indicates cessation of colchicine therapy. (b) Serum cytokines were assayed in the NLRC4-MAS patient, healthy pediatric controls, the patient’s family, and matched samples from six NOMID patients pre and post anakinra treatment. Control samples are grouped together. Horizontal line represents lower limit of detection. ***p<0.0001 for unpaired two-tailed student’s T-test of all NOMID patient samples versus all samples from NLRC4-MAS patient.

Comment in

References

    1. Strowig T, Henao-Mejia J, Elinav E, Flavell R. Inflammasomes in health and disease. Nature. 2012;481:278–286. - PubMed
    1. Hoffman HM, Mueller JL, Broide DH, Wanderer AA, Kolodner RD. Mutation of a new gene encoding a putative pyrin-like protein causes familial cold autoinflammatory syndrome and Muckle-Wells syndrome. Nat Genet. 2001;29:301–305. - PMC - PubMed
    1. Ting JP, et al. The NLR gene family: a standard nomenclature. Immunity. 2008;28:285–287. - PMC - PubMed
    1. Wen H, Miao EA, Ting JP. Mechanisms of NOD-like receptor-associated inflammasome activation. Immunity. 2013;39:432–441. - PMC - PubMed
    1. Faustin B, et al. Reconstituted NALP1 inflammasome reveals two-step mechanism of caspase-1 activation. Mol Cell. 2007;25:713–724. - PubMed

Publication types

MeSH terms

Associated data