

Age-specific malaria seroprevalence rates: a cross-sectional analysis of malaria transmission in the Ouest and Sud-Est departments of Haiti
- PMID: 25218803
- PMCID: PMC4172790
- DOI: 10.1186/1475-2875-13-361
Age-specific malaria seroprevalence rates: a cross-sectional analysis of malaria transmission in the Ouest and Sud-Est departments of Haiti
Abstract
Background: Malaria transmission continues to occur in Haiti, with 25,423 confirmed cases of Plasmodium falciparum and 161,236 suspected infections reported in 2012. At low prevalence levels, passive surveillance measures, which rely primarily on reports from health systems, becomes less appropriate for capturing annual malaria incidence. To improve understanding of malaria transmission in Haiti, participants from the Ouest and Sud-Est departments were screened using a highly sensitive enzyme-linked immunosorbent assay (ELISA).
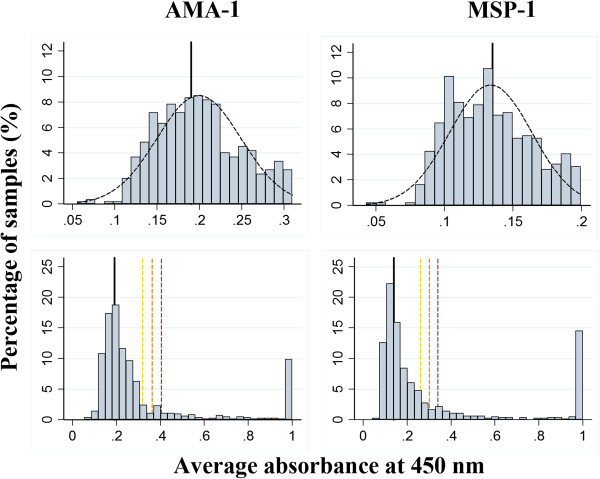
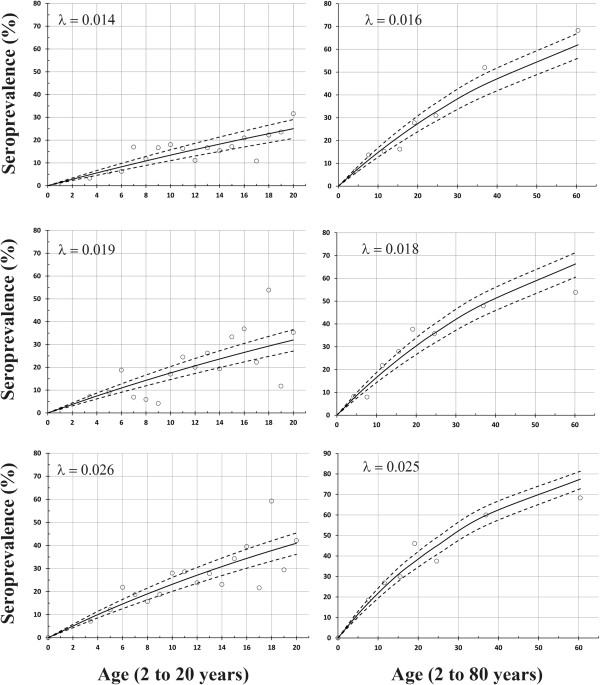
Methods: Between February and May 2013, samples were collected from four different sites including a rural community, two schools, and a clinic located in the Ouest and Sud-Est departments of Haiti. A total of 815 serum samples were screened for malaria antibodies using an indirect ELISA coated with vaccine candidates apical membrane antigen (AMA-1) and merozoite surface protein-1 (MSP-119). The classification of previous exposure was established by using a threshold value that fell three standard deviations above the mean absorbance for suspected seronegative population members (OD of 0.32 and 0.26 for AMA-1 and MSP-1, respectively). The observed seroprevalence values were used to fit a modified reverse catalytic model to yield estimates of seroconversion rates.
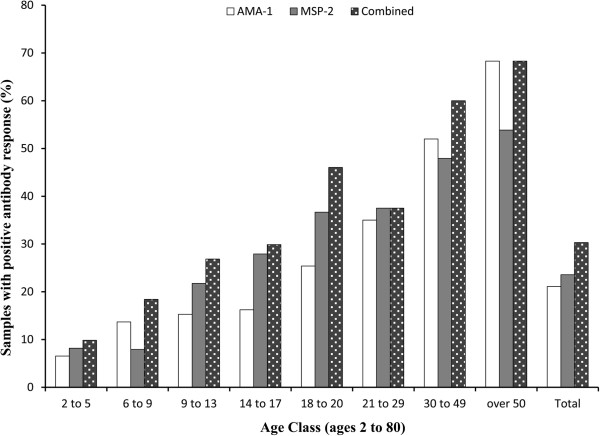
Results: Of the samples screened, 172 of 815 (21.1%) were AMA-1 positive, 179 of 759 (23.6%) were MSP-119 positive, and 247 of 815 (30.3%) were positive for either AMA-1 or MSP-1; indicating rates of previous infections between 21.1% and 30.3%. Not surprisingly, age was highly associated with the likelihood of previous infection (p-value <0.001). After stratification by age, the estimated seroconversion rate indicated that the annual malaria transmission in the Ouest and Sud-Est department is approximately 2.5% (95% CI SCR: 2.2%, 2.8%).
Conclusions: These findings suggest that despite the absence of sustained malaria control efforts in Haiti, transmission has remained relatively low over multiple decades. Elimination in Haiti appears to be feasible; however, surveillance must continue to be strengthened in order to respond to areas with high transmission and measure the impact of future interventions.
Figures


Similar articles
-
Sparse serological evidence of Plasmodium vivax transmission in the Ouest and Sud-Est departments of Haiti.Acta Trop. 2016 Oct;162:27-34. doi: 10.1016/j.actatropica.2016.05.011. Epub 2016 May 24. Acta Trop. 2016. PMID: 27230796
-
Using serological measures to monitor changes in malaria transmission in Vanuatu.Malar J. 2010 Jun 16;9:169. doi: 10.1186/1475-2875-9-169. Malar J. 2010. PMID: 20553604 Free PMC article.
-
Seasonal changes in the antibody responses against Plasmodium falciparum merozoite surface antigens in areas of differing malaria endemicity in Indonesia.Malar J. 2013 Dec 9;12:444. doi: 10.1186/1475-2875-12-444. Malar J. 2013. PMID: 24321092 Free PMC article.
-
Serological markers for monitoring historical changes in malaria transmission intensity in a highly endemic region of Western Kenya, 1994-2009.Malar J. 2014 Nov 22;13:451. doi: 10.1186/1475-2875-13-451. Malar J. 2014. PMID: 25416454 Free PMC article.
-
Access and coverage of malaria services in Haiti in the context of elimination: a scoping review of the literature.BMC Health Serv Res. 2024 Dec 18;24(1):1588. doi: 10.1186/s12913-024-12063-z. BMC Health Serv Res. 2024. PMID: 39696361 Free PMC article.
Cited by
-
High prevalence of asymptomatic malaria infections: a cross-sectional study in rural areas in six departments in Haiti.Malar J. 2015 Dec 21;14:510. doi: 10.1186/s12936-015-1051-2. Malar J. 2015. PMID: 26689195 Free PMC article.
-
Field Trial of the CareStart Biosensor Analyzer for the Determination of Glucose-6-Phosphate Dehydrogenase Activity in Haiti.Am J Trop Med Hyg. 2017 Oct;97(4):1262-1270. doi: 10.4269/ajtmh.16-0714. Epub 2017 Aug 18. Am J Trop Med Hyg. 2017. PMID: 28820691 Free PMC article.
-
Serological markers to measure recent changes in malaria at population level in Cambodia.Malar J. 2016 Nov 4;15(1):529. doi: 10.1186/s12936-016-1576-z. Malar J. 2016. PMID: 27809852 Free PMC article.
-
Use of Bead-Based Serologic Assay to Evaluate Chikungunya Virus Epidemic, Haiti.Emerg Infect Dis. 2018 Jun;24(6):995-1001. doi: 10.3201/eid2406.171447. Emerg Infect Dis. 2018. PMID: 29774861 Free PMC article.
-
Spectrum of outpatient illness in a school-based cohort in Haiti, with a focus on diarrheal pathogens.Am J Trop Med Hyg. 2015 Apr;92(4):752-757. doi: 10.4269/ajtmh.14-0059. Epub 2015 Mar 2. Am J Trop Med Hyg. 2015. PMID: 25732684 Free PMC article.
References
-
- Clinton Health Access Initiative . The feasibility of malaria elimination on the island of Hispaniola, with a focus on Haiti. 2013.
-
- WHO . World malaria report 2013. Geneva: World Health Organization; 2013.
Publication types
MeSH terms
Substances
LinkOut - more resources
Full Text Sources
Other Literature Sources
Research Materials
