

Digital quantitation of HCC-associated stem cell markers and protein quality control factors using tissue arrays of human liver sections
- PMID: 25218810
- PMCID: PMC4262606
- DOI: 10.1016/j.yexmp.2014.09.002
Digital quantitation of HCC-associated stem cell markers and protein quality control factors using tissue arrays of human liver sections
Abstract
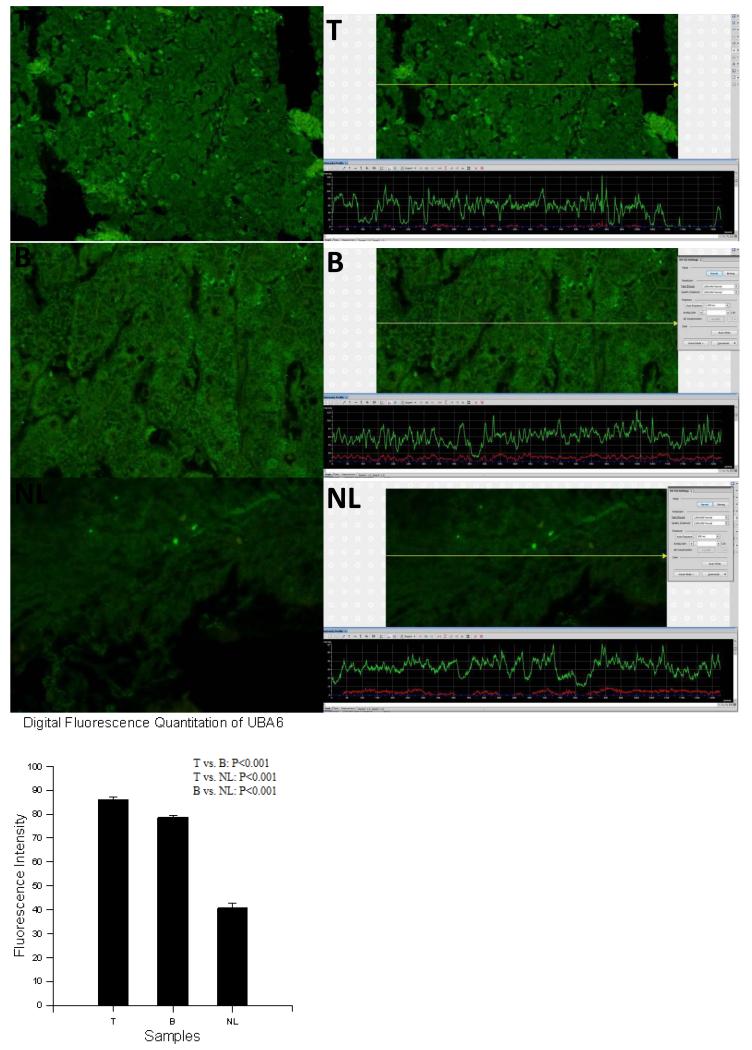
The most common type of liver cancer, hepatocellular carcinoma (HCC), affects over 500,000 people in the world. In the present study, liver tumor resections were used to prepare tissue arrays to examine the intensity of fluorescence of IHC stained stem cell markers in liver tissue from malignant HCC tumors and accompanying surrounding non-tumor liver. We hypothesized that a correlation exists between the fluorescence intensity of IHC stained HCC and surrounding non-tumor liver compared to liver tissue from a completely normal liver. 120 liver resection specimens (including four normal controls) were placed on a single slide to make a tissue array. They were examined by digitally quantifying the intensity of fluorescence using immuno-histochemically stained stem cell markers and protein quality control proteins. The stem cell markers were OCT3/4, Nanog, CD133, pEZH2, CD49F and SOX2. The protein quality control proteins were FAT10, UBA-6 and ubiquitin. The data collected was used to compare normal liver tissue with HCCs and parent liver tissue resected surgically using antibodies to stem cell markers and quality control protein markers. The measurements of the stem cell marker CD133 indicated an increase of fluorescence intensity for both the parent liver tissue and the HCC liver tissues. The other stem cell markers changed as follows: Nanog and OCT3/4 were decreased in both the HCCs and the parent livers; PEZH2 was reduced in the HCCs; SOX2 was increased in the parent livers compared to the controls; and CD49f was decreased in HCCs only. Protein quality control markers FAT10 and ubiquitin were downregulated in both the HCCs and the adjacent non-tumor tissue compared to the controls. UBA6 was increased in both the HCCs and the parent livers, and the levels were higher in the HCCs compared to the parent livers.
Keywords: Hepatocellular carcinoma (HCC); Morphometric analysis; Protein quality control pathways; Stem cells.
Copyright © 2014 Elsevier Inc. All rights reserved.
Figures


Similar articles
-
The identification of stem cells in human liver diseases and hepatocellular carcinoma.Exp Mol Pathol. 2010 Jun;88(3):331-40. doi: 10.1016/j.yexmp.2010.01.003. Epub 2010 Jan 18. Exp Mol Pathol. 2010. PMID: 20080086 Free PMC article.
-
Hepatocellular carcinomas expressing 'stemness'-related markers: clinicopathological characteristics.Dig Dis. 2014;32(6):778-85. doi: 10.1159/000368021. Epub 2014 Oct 29. Dig Dis. 2014. PMID: 25376296 Review.
-
Loss of ATOH8 Increases Stem Cell Features of Hepatocellular Carcinoma Cells.Gastroenterology. 2015 Oct;149(4):1068-81.e5. doi: 10.1053/j.gastro.2015.06.010. Epub 2015 Jun 20. Gastroenterology. 2015. PMID: 26099525
-
Genetic alterations and expression of PTEN and its relationship with cancer stem cell markers to investigate pathogenesis and to evaluate prognosis in hepatocellular carcinoma.J Clin Pathol. 2019 Sep;72(9):588-596. doi: 10.1136/jclinpath-2019-205769. Epub 2019 May 24. J Clin Pathol. 2019. PMID: 31126975
-
Biology and clinical implications of CD133(+) liver cancer stem cells.Exp Cell Res. 2013 Jan 15;319(2):126-32. doi: 10.1016/j.yexcr.2012.09.007. Epub 2012 Sep 19. Exp Cell Res. 2013. PMID: 22999864 Review.
Cited by
-
Revealing a novel Decorin-expressing tumor stromal subset in hepatocellular carcinoma via integrative analysis single-cell RNA sequencing.Cancer Cell Int. 2025 May 26;25(1):194. doi: 10.1186/s12935-025-03811-0. Cancer Cell Int. 2025. PMID: 40420150 Free PMC article.
-
NUB1 and FAT10 Proteins as Potential Novel Biomarkers in Cancer: A Translational Perspective.Cells. 2021 Aug 24;10(9):2176. doi: 10.3390/cells10092176. Cells. 2021. PMID: 34571823 Free PMC article. Review.
-
A novel multimarker assay for the phenotypic profiling of circulating tumor cells in hepatocellular carcinoma.Liver Transpl. 2018 Jul;24(7):946-960. doi: 10.1002/lt.25062. Liver Transpl. 2018. PMID: 29624843 Free PMC article.
-
UBA6 and Its Bispecific Pathways for Ubiquitin and FAT10.Int J Mol Sci. 2019 May 7;20(9):2250. doi: 10.3390/ijms20092250. Int J Mol Sci. 2019. PMID: 31067743 Free PMC article. Review.
References
-
- Eiro N, Atadil A, Juarez LM, Rodriquez M, Gonzales LD, Atienza S, Bermudez S, Fernandez-Garcia B, Fresno-Forcelledo MF, Rodrigo L, Vizoso FJ. Toll-like receptors 3,4and 9 in hepatocellular carcinoma: Relationship with clinical pathological characteristics and prognosis. Hepatol Res. 2014;44:769–778. - PubMed
Publication types
MeSH terms
Substances
Grants and funding
LinkOut - more resources
Full Text Sources
Other Literature Sources
Medical
Research Materials
