. 2014 Oct 2;56(1):90-103.
doi: 10.1016/j.molcel.2014.08.011. Epub 2014 Sep 11.

A global regulatory mechanism for activating an exon network required for neurogenesis

Affiliations

A global regulatory mechanism for activating an exon network required for neurogenesis

Bushra Raj et al. Mol Cell. .

Abstract

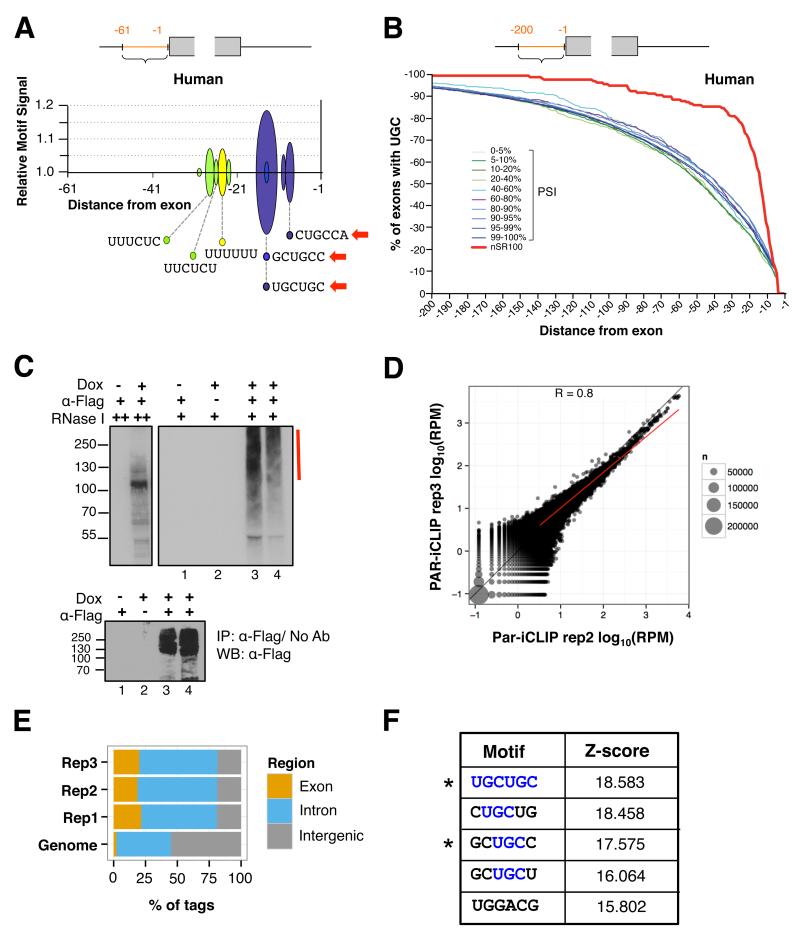
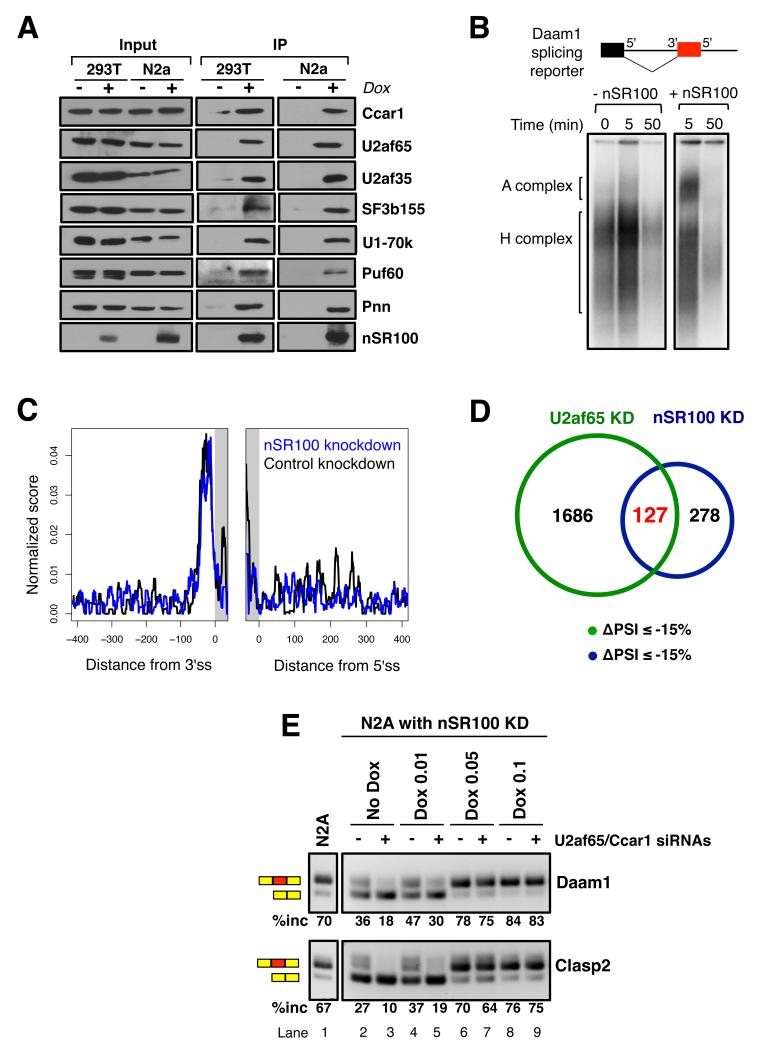
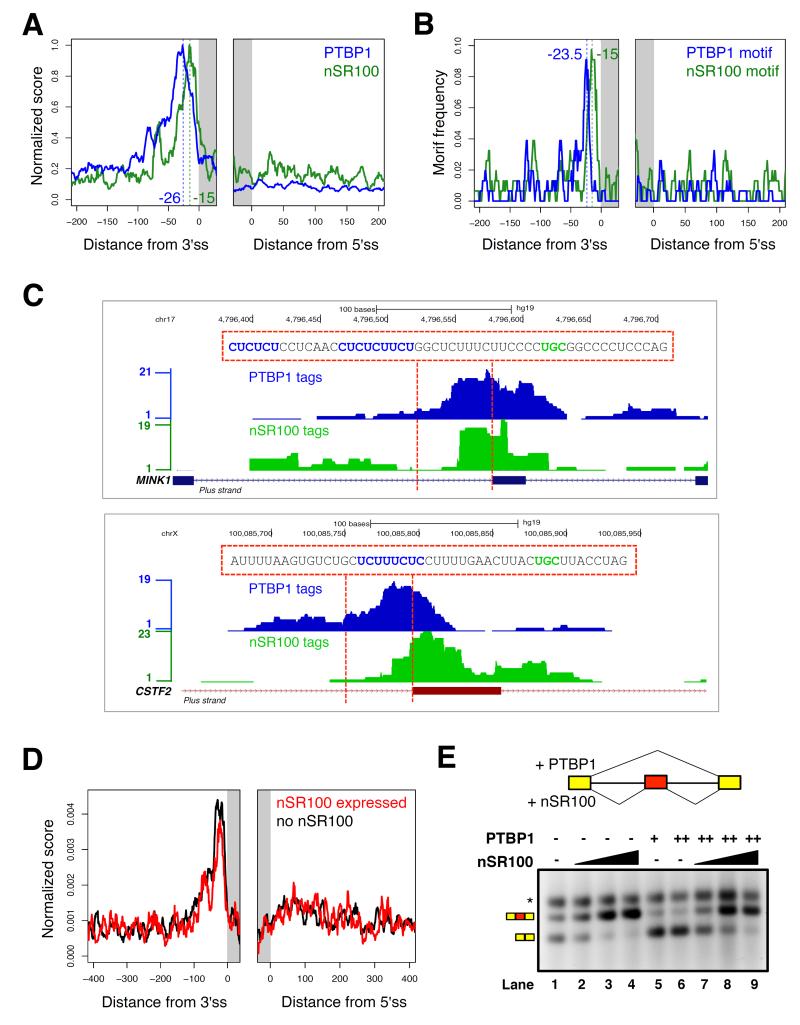
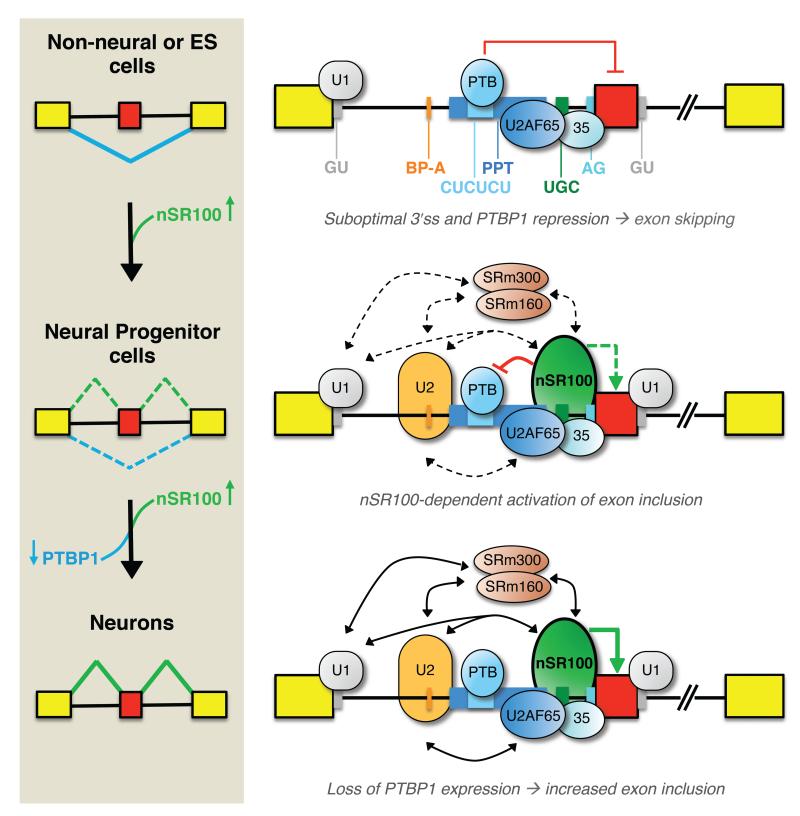
The vertebrate and neural-specific Ser/Arg (SR)-related protein nSR100/SRRM4 regulates an extensive program of alternative splicing with critical roles in nervous system development. However, the mechanism by which nSR100 controls its target exons is poorly understood. We demonstrate that nSR100-dependent neural exons are associated with a unique configuration of intronic cis-elements that promote rapid switch-like regulation during neurogenesis. A key feature of this configuration is the insertion of specialized intronic enhancers between polypyrimidine tracts and acceptor sites that bind nSR100 to potently activate exon inclusion in neural cells while weakening 3' splice site recognition and contributing to exon skipping in nonneural cells. nSR100 further operates by forming multiple interactions with early spliceosome components bound proximal to 3' splice sites. These multifaceted interactions achieve dominance over neural exon silencing mediated by the splicing regulator PTBP1. The results thus illuminate a widespread mechanism by which a critical neural exon network is activated during neurogenesis.


Figures

Figure 1
Figure 1. RNA-Seq identifies an extensive network of conserved neural-enriched exons regulated by nSR100
(A and B) Top panels, scatterplots comparing changes in inclusion levels (|ΔPSI| ≥ 15%) of AS events upon altering nSR100 levels versus differences in inclusion levels between neural and non-neural tissues. ΔPSI nSR100, change in PSI levels of alternative exons following: (A) nSR100 knockdown in N2A cells, and (B) dox-induced nSR100 expression in 293T cells. ΔPSI Neural, difference in mean PSI level of regulated exons between neural and non-neural tissues (Table S1; Supplemental Experimental Procedures). Exons with ΔPSI Neural ≥ 20% (dotted line) were considered neural-enriched. Orthologous exons that show nSR100-dependent regulation in both N2A and 293T cells are circled in red (inclusion, 157 exons) or black (skipping, 5 exons). Bottom panels, RT-PCR assays and western blots confirming changes in nSR100 protein levels. Tubulin, gapdh and β-actin detection was used as loading controls. (C) Venn diagrams indicating overlap between nSR100-promoted (left) and nSR100-inhibited (right) orthologous alternative exons in N2A and 293T cells. (D and E) Examples of RT-PCR validations of conserved nSR100-regulated AS events upon: (D) nSR100 knockdown in N2A cells, and (E) dox-induced nSR100 expression in 293T cells. See also Figure S1 and Table S1.
Figure 2
Figure 2. UGC-containing motifs are enriched adjacent to target exons and are directly bound by nSR100 in vivo
(A) PEAKS analysis plot showing sequences and distances of peaks of significantly enriched hexamers in intron sequences upstream of the 3′ splice sites of conserved, nSR100-regulated human exons. Red arrows, hexamers with UGC triplets. (B) Cumulative distribution plots indicating the position of the first UGC triplet within 200 nucleotides upstream of conserved, nSR100-regulated (red) and control alternative or constitutive human exons with different PSI ranges (blue, purple and green lines). (C) Top panel, protein gel autoradiographs of nSR100-RNA 32P-labeled complexes after high (++) and low (+) RNase I digestion in 293T cells induced to express Flag-nSR100. Red bar, region of the gel excised for library generation; Bottom panel, western blot confirming immunoprecipitation of Flag-nSR100 protein. (D) Scatterplot showing correlation between mappings of reads in 100 base pair genomic bins using data from two biological replicates of nSR100 293T PAR-iCLIP experiments. (E) Bar plots showing the distributions of nSR100 293T PAR-iCLIP tags in exon, intron, and intergenic sequences from three independent PAR-iCLIP experiments. “Genome” indicates the distribution of a subset of randomly chosen genomic positions. (F) Top five-most enriched hexamers and their corresponding Z-scores identified using PAR-iCLIP analyses. Asterisks, motifs that were also identified using PEAKS. See also Figure S2.
Figure 3
Figure 3. nSR100 binds directly upstream of suboptimal 3′ splice sites to promote neural exon inclusion
(A) nSR100 RNA binding map showing the mean, normalized density of crosslinked sites in 400 nucleotide windows encompassing nSR100-regulated exons (blue) and control non-regulated exons (gray) in 293T cells; ss, splice site. (B) Top panel, genome browser view of the raw density of nSR100 293T PAR-iCLIP tags surrounding the UGC motif (orange box) upstream of the REST neural exon. Bottom panel, RT-PCR assay monitoring inclusion levels of the REST neural exon upon transfection of wild-type (W) or mutant (M) minigene reporters into 293T cells with and without dox-induced nSR100 expression. (C) Box plots comparing the 3′ and 5′ splice site strengths of conserved nSR100 target exons (blue) and control, non-regulated exons (white). Asterisks represent significant differences; p values, Wilcoxon rank sum test. (D) Plots comparing polypyrimidine tract lengths and distances between 3′ splice sites and inferred branch points of nSR100 regulated exons (red), and of PSI-matched control exons (gray) in human; p values, Kolmogorov-Smirnov test. (E) RT-PCR assays monitoring the effects of mutating UGC motif(s) on inclusion levels of the DAAM1 and MEF2D neural exons. Dox-inducible nSR100-expressing 293T cells were transfected with wild-type (W) minigene reporters (lanes 1-2). 293T cells (not dox-inducible) were transfected with wild-type or mutant (M, M1, M2) reporters, and control (lanes 3, 5, 7) or PTBP1 and PTBP2 siRNAs (lanes 4, 6, 8). PPT, polypyrimidine tract. Asterisk represents a product from usage of an alternative splice site. See also Figure S3.
Figure 4
Figure 4. nSR100 interaction partners are enriched in early-acting splicing complex proteins
(A) Co-immunoprecipitation western blot assays validating AP-MS-detected interactions between nSR100 and binding partners in 293T and N2A cells, with and without dox-induced Flag-nSR100 expression. Flag-nSR100 complexes were immunoprecipitated with anti-Flag antibody and blots were probed with antibodies specific for the interaction partners, as indicated. (B) Native agarose gel electrophoresis of pre-spliceosomal complexes. A radiolabeled Daam1 reporter was incubated with Weri-Rb1 splicing extracts in the presence of ATP at 30 °C for the indicated lengths of time, and the complexes were run out on a 2% agarose gel. (C) U2af65 RNA binding map showing the mean, normalized density of crosslinked sites in 400 nucleotide windows encompassing nSR100-regulated exons in N2A cells expressing nSR100-targeting (blue), or control (black) shRNAs; ss, splice site. (D) Venn diagram representing the overlap between AS events promoted by U2af65 and nSR100. Exons displaying increased skipping upon U2af65 or nSR100 knockdowns were compared (ΔPSI ≤ -15%). (E) A stable N2A cell line expressing nSR100-targeting shRNAs and an shRNA-resistant, dox-inducible nSR100 cDNA was transfected with non-targeting control siRNA (lanes 2, 4, 6, 8) or U2af65 and Ccar1 siRNAs (lanes 3, 5, 7, 9). nSR100 expression was induced by titrating dox concentration from 0 μg/ml (lanes 2-3) to 0.1 μg/ml (lanes 8-9). RT-PCR assays were used to monitor changes in inclusion levels of nSR100-regulated exons upon altering U2af65, Ccar1 and nSR100 levels. Lane 1 shows splicing levels in a parental N2A cell line for comparison. See also Figure S4 and Tables S2 and S3.
Figure 5
Figure 5. Opposing regulation of neural exons by PTBP1 and nSR100
(A) N2A cells were transfected with control or Ptbp1 siRNAs, and RT-PCR assays and western blots were used to confirm Ptbp1 knockdown. Tubulin and gapdh detection was used to control for loading. (B) Venn diagrams showing the overlap between AS events repressed by Ptbp1 and promoted by nSR100 (left), or repressed by Ptbp1 and nSR100 (right) in N2A cells. Exons displaying increased inclusion upon Ptbp1 depletion (ΔPSI ≥ 15%) were compared with those that change upon nSR100 knockdown. (C) RT-PCR assays monitoring changes in inclusion levels of target exons upon knockdown of Ptbp1 or nSR100 in N2A cells. (D) Western blots monitoring nSR100 and Ptbp1 protein levels in mouse cortex tissues during development (E – embryonic, P – postnatal). Tubulin detection was used as a loading control. (E) Line graphs showing the relative levels of gene expression of nSR100 (blue), Ptbp1 (orange), and the median PSI levels (red) of alternative exons subjected to opposing regulation by Ptbp1 and nSR100 during in vitro differentiation of embryonic stem cells (ESC) to cortical glutamatergic neurons. NESC, neuroepithelial stem cells; Radial NP, radial neural progenitors; DIV, days in vitro. See also Figure S5 and Table S4.
Figure 6
Figure 6. nSR100 directly overcomes PTBP1-mediated repression to promote exon inclusion
(A) Merged RNA binding map showing the mean, normalized density of PTBP1 (blue) and nSR100 (green) crosslinked sites in 200 nucleotide windows encompassing conserved nSR100-regulated exons in 293T cells; ss, splice site. (B) Distribution of PTBP1 and nSR100 binding motifs in 200 nucleotide windows surrounding conserved nSR100 target exons in human. (C) Representative genome browser tracks showing the raw density of PTBP1 (blue) and nSR100 (green) PAR-iCLIP tags flanking the MINK1 (top) and CSTF2 (bottom) target exons. Genomic sequences between the dotted lines are displayed with binding sites for PTBP1 (blue) and nSR100 (green) highlighted. (D) RNA binding maps of the mean, normalized density of PTBP1 crosslinked sites surrounding conserved nSR100-regulated exons in control uninduced (black) and dox-induced nSR100-expressing (red) 293T cells. (E) In vitro splicing assay monitoring AS of the Daam1 neural exon in the presence and absence of purified nSR100 and/or PTBP1 proteins in Weri-Rb1 splicing extracts. The splicing reporter consists of constitutively spliced 5′ and 3′ MINX exons and the Daam1 neural exon flanked by its native intron sequences. Amount of proteins used: Lane 1: no protein; lanes 2, 3 and 4: 50, 100 and 200 ng nSR100, respectively; lanes 5 and 6: 100 and 200 ng PTBP1, respectively; lanes 7, 8 and 9: 200 ng PTBP1 and 50, 100 or 200 ng nSR100, respectively. Asterisk, non-specific band. See also Figure S6.
Figure 7
Figure 7. Mechanistic model for nSR100-dependent regulation of neural exon alternative splicing
Alternative exons in the nSR100-regulated network are associated with a unique arrangement of cis-elements that weaken 3′ splice sites, and act in conjunction with negative regulation mediated by PTBP1 to cause skipping of target exons in non-neural cells. When nSR100 is expressed in differentiating neural precursors and mature neurons it binds to intronic enhancers proximal to 3 splice sites, and also interacts with multiple early-acting spliceosomal components, to promote exon inclusion. These interactions are sufficient to potently outcompete PTBP1-mediated repression. As neurons develop, PTBP1 is no longer expressed, enabling maximal nSR100-dependent neural exon inclusion.

Similar articles

Cited by

References

    1. Akhtar MW, Kim M-S, Adachi M, Morris MJ, Qi X, Richardson JA, Bassel-Duby R, Olson EN, Kavalali ET, Monteggia LM. In vivo analysis of MEF2 transcription factors in synapse regulation and neuronal survival. PLoS ONE. 2012;7:e34863. - PMC - PubMed
    1. Änkö M-L. Regulation of gene expression programmes by serine-arginine rich splicing factors. Semin. Cell Dev. Biol. 2014;32:11–21. - PubMed
    1. Barbosa-Morais NL, Irimia M, Pan Q, Xiong HY, Gueroussov S, Lee LJ, Slobodeniuc V, Kutter C, Watt S, Çolak R, et al. The evolutionary landscape of alternative splicing in vertebrate species. Science. 2012;338:1587–1593. - PubMed
    1. Bellora N, Farré D, Mar Albà M. PEAKS: identification of regulatory motifs by their position in DNA sequences. Bioinformatics. 2007;23:243–244. - PubMed
    1. Boutz PL, Stoilov P, Li Q, Lin C-H, Chawla G, Ostrow K, Shiue L, Ares M, Black DL. A post-transcriptional regulatory switch in polypyrimidine tract-binding proteins reprograms alternative splicing in developing neurons. Genes Dev. 2007;21:1636–1652. - PMC - PubMed

Publication types

Substances