. 2014 Nov:317:1-8.
doi: 10.1016/j.heares.2014.08.004. Epub 2014 Sep 9.

Prolonged noise exposure-induced auditory threshold shifts in rats

Affiliations

Prolonged noise exposure-induced auditory threshold shifts in rats

Guang-Di Chen et al. Hear Res. 2014 Nov.

Abstract

Noise-induced hearing loss (NIHL) initially increases with exposure duration, but eventually reaches an asymptotic threshold shift (ATS) once the exposure duration exceeds 18-24 h. Equations for predicting the ATS have been developed for several species, but not for rats, even though this species is extensively used in noise exposure research. To fill this void, we exposed rats to narrowband noise (NBN, 16-20 kHz) for 5 weeks starting at 80 dB SPL in the first week and then increasing the level by 6 dB per week to a final level of 104 dB SPL. Auditory brainstem responses (ABR) were recorded before, during, and following the exposure to determine the amount of hearing loss. The noise induced threshold shift to continuous long-term exposure, defined as compound threshold shift (CTS), within and above 16-20 kHz increased with noise level at the rate of 1.82 dB threshold shift per dB of noise level (NL) above a critical level (C) of 77.2 dB SPL i.e. CTS = 1.82(NL-77.2). The normalized amplitude of the largest ABR peak measured at 100 dB SPL decreased at the rate of 3.1% per dB of NL above the critical level of 76.9 dB SPL, i.e., %ABR Reduction = 3.1%(NL-76.9). ABR thresholds measured >30 days post-exposure only partially recovered resulting in a permanent threshold shift of 30-40 dB along with severe hair cell loss in the basal, high-frequency region of the cochlea. In the rat, CTS increases with noise level with a slope similar to humans and chinchillas. The critical level (C) in the rat is similar to that of humans, but higher than that of chinchillas.


Figures

Figure 1
Figure 1
One-third octave band analysis of the 16-20 kHz NBN measured with the overall level set at 104 dB SPL.
Figure 2
Figure 2
(A): Normal ABR thresholds as a function of frequency. (B) Assessment of ABR amplitude; the amplitude was measured between the highest positive peak (~2.2 ms) and the greatest negative peak (~3.3 ms).
Figure 3
Figure 3
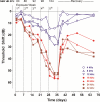
Mean ABR threshold shifts measured during and after the 16-20 kHz NBN exposure. The rats (n=6) were exposed for seven consecutive days at 80 dB SPL in the 1st week, 86 dB SPL in the 2nd week, 92 dB SPL in the 3rd week, 98 dB SPL in the 4th week, and for 8 consecutive days at 104 dB SPL in the 5th week. ABR threshold shifts were measured at the 25th hour and the 121st hour in each exposure-week and at 2, 4, 8, 16, and 30 post-exposure days. For clarity, error bars not shown.
Figure 4
Figure 4
Mean (n=6 animals, SEM error bar) ABR threshold shifts for (A) 4 kHz, (B) 8 kHz, (C) 12 kHz, (D) 16 kHz, (E) 20 kHz, (F) 24 kHz and (G) 32 kHz versus intensity level of the NBN. Thresholds shifts, measured at the 25th and 121st h after the start of each NBN level were used to compute the CTS for each NBN level increase. Data in each panel fit by linear regression (solid line) to the function CTS = R (NL – C) where NL is noise intensity level in dB SPL, C is the critical level in dB SPL and R is the slope expressed as dB CTS per dB intensity level increase of the NBN. Each panel shows the goodness of fit (r2), the slope, R, and the critical level, C.
Figure 5
Figure 5
Mean (SEM error bar) threshold shifts as a function of NBN intensity level for frequencies within and above the NBN (16, 20, 24 and 32 kHz). Data fit by linear regression (solid line) to the function CTS = R (NL – C) where NL is noise level in dB, C is the critical level in dB SPL and R is the slope expressed as dB CTS per dB level increase of the NBN; goodness of fit (r2), slope, R, and critical level, C, shown in inset.
Figure 6
Figure 6
ABR amplitude (see Figure 2) at 4, 8, 12, 16, 20, 24 and 32 kHz before (0 d), during the 1st through 5th week of the NBN exposure at the intensity level indicated and during the recovery period. For clarity, SEM and click data are not shown.
Figure 7
Figure 7
Mean (n=6, SEM) percent reductions of ABR amplitude relative to baseline amplitude as a function of NBN intensity level. ABR amplitudes declined approximately linearly with increase in NBN level. Data in each panel fitted to function: ABR Amplitude Reduction (%) = R (NL-C); R, C and goodness of fit (r2) shown in each panel. Percent reduction of ABR amplitude for test frequencies: (A) 16 kHz, (B) 20 kHz, (C) 24 kHz, (D) 32 kHz and (E) the average of 16, 20, 24 and 32 kHz.
Figure 8
Figure 8
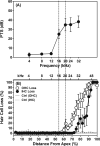
(A) Mean (n=6, SEM) permanent ABR threshold shifts as a function of frequency. (B) Mean (n=6, SEM) OHC and IHC loss as a function of percent distance from the apex of the cochlea; percent distance from the apex related to frequency using the cochlear frequency-place map for the rat. Solid and dashed lines are OHC and IHC counting respectively in control rats (n=5).

References

    1. Atherley GR, Hempstock TI, Noble WG. Study of tinnitus induced temporarily by noise. J Acoust Soc Am. 1968;44:1503–1506. - PubMed
    1. Atik A. Pathophysiology and Treatment of Tinnitus: An Elusive Disease. Indian journal of otolaryngology and head and neck surgery : official publication of the Association of Otolaryngologists of India. 2014;66:1–5. - PMC - PubMed
    1. Axelsson A, Hamernik RP. Acute acoustic trauma. Acta oto-laryngologica. 1987;104:225–233. - PubMed
    1. Axelsson A, Sandh A. Tinnitus in noise-induced hearing loss. British journal of audiology. 1985;19:271–276. - PubMed
    1. Blakeslee EA, Hynson K, Hamernik RP, Henderson D. Asymptotic threshold shift in chinchillas exposed to impulse noise. J Acoust Soc Am. 1978;63:876–882. - PubMed

Publication types