

The impact of early intra-articular administration of interleukin-1 receptor antagonist on lubricin metabolism and cartilage degeneration in an anterior cruciate ligament transection model
- PMID: 25219670
- PMCID: PMC4275352
- DOI: 10.1016/j.joca.2014.09.006
The impact of early intra-articular administration of interleukin-1 receptor antagonist on lubricin metabolism and cartilage degeneration in an anterior cruciate ligament transection model
Abstract
Objective: Study the impact of intra-articular interleukin-1 receptor antagonist (IL-1 ra) treatment on lubricin biosynthesis following anterior cruciate ligament transection (ACLT) in the rat and evaluate the effect of combined IL-1 ra and recombinant human lubricin (rhPRG4) treatments on chondrocyte apoptosis.
Methods: ACLT was performed in male Lewis rats. Treatments included IL-1 ra or vehicle (n = 36 in each group). IL-1 ra intra-articular dosing was performed on days 1, 3, 5 and 7 following ACLT using Anakinra (150 mg/ml; 40 μl). At 3 and 5 weeks, animals were sacrificed and RNA was isolated. Histological analyses included Safranin O and H&E. Lubricin synovial fluid (SF) lavage concentrations were determined at 5 weeks. ACLT animals were treated with a single injection of vehicle, IL-1 ra (75 mg/ml; 40 μl), rhPRG4 (200 μg/ml; 40 μl), or IL-1 ra + rhPRG4 (75 mg/ml + 200 μg/ml; 40 μl) (n = 6 in each group) on day 7 following ACLT and cartilage was probed for cleaved caspase-3 at 5 weeks.
Results: IL-1 ra treatment improved lubricin expression (P < 0.001) and lubricin SF lavage concentrations in the IL-1 ra group was higher (P = 0.005) than the vehicle. IL-1 ra treatment reduced cartilage and synovial scores (P < 0.001) compared to vehicle. IL-1 ra and rhPRG4 acted synergistically to reduce caspase-3 positive chondrocytes (P < 0.001) compared to individual treatments.
Conclusion: IL-1 ra treatment preserved lubricin following ACLT and a combined treatment of IL-1 ra + rhPRG4 may act synergistically to reduce cartilage catabolism.
Keywords: Interleukin-1 receptor antagonist; Lubricin; Posttraumatic osteoarthritis.
Copyright © 2014 Osteoarthritis Research Society International. Published by Elsevier Ltd. All rights reserved.
Conflict of interest statement
Both GJ and TS have a financial interest in, and are named inventors on issued patents held by a commercial entity developing rhPRG4 for therapeutic uses.
Figures

Relative lubricin cartilage expression in control and ACLT joints compared to contra-alteral joints and normalized to glyceraldehyde-3-phosphare dehydrogenase (GAPDH) and received intra-articular injections of PBS or IL-1 ra. Individual data points are presented and the median value is highlighted with an “X”.
*Indicates that lubricin cartilage expression in control joints was significantly higher compared to 3-week and 5-week ACLT treated with PBS or IL-1 ra (p<0.001).
**Indicates that lubricin cartilage expression in 3 week ACLT joints treated with IL-1 ra was significantly higher compared with 3 and 5 week ACLT joints treated with PBS (p=0.002), (p=0.001).
***Indicates that lubricin cartilage expression in 5 week ACLT joints treated with IL-1 ra was significantly higher compared with 5 week ACLT joints treated with PBS (p=0.001).
mAb 9G3 immunostaining for lubricin from (A) control, (B) 3-week ACLT joints treated with PBS, (C) 3-week ACLT joints treated with IL-1 ra, (D) 5-week ACLT joints treated with PBS, and (E) 5-week ACLT joints treated with IL-1 ra. Arrows point to intense lubricin staining on the surface of articular cartilage and in superficial zone chondrocytes compared to 3 and 5 week ACLT joints treated with PBS. Scale = 50 µm.
Urea-adjusted lubricin SF lavage concentrations in control, 5-week ACLT animals following treatment with PBS or IL-1 ra (n=6 in each group). Individual data points are presented and the median value is highlighted with an “X”.
*Indicates that lubricin SF lavage concentrations in control animals were significantly higher compared with 5-week ACLT joints treated with PBS (p<0.001).
**Indicates that lubricin SF lavage concentrations in 5-week ACLT animals treated with IL-1 ra was significantly higher compared with 5-week ACLT animals treated with PBS (p=0.005).

Representative Safranin-O (top panel) stained cartilage and Hematoxylin & Eosin (H&E; bottom panel) stained synovium from control animals and animals that underwent ACLT followed by intra-articular injection of PBS on days 1, 3, 5 and 7 (PBS) or IL-1 ra (IL-1 ra). The arrow points to synovial thickening and infiltration of inflammatory cells in the PBS-treated group. Scale = 50 µm.
Modified OARSI scores of control (n=5), PBS-treated ACLT animals (n=9) and IL-1 ra-treated ACLT animals (n=9). Individual data points are presented and the median value is highlighted with an “X”.
*Indicates that OARSI scores of the PBS group was significantly higher than OARSI scores of control or the IL-1 ra groups (p<0.001).
Synovial histopathology scores of control (n=5), PBS-treated ACLT animals (n=9) and IL-1 ra-treated ACLT animals (n=9). Individual data points are presented and the median value is highlighted with an “X”.
*Indicates that synovial histopathology scores of PBS-treated ACLT animals were significantly higher than control and IL-1 ra-treated ACLT animals (p<0.001).
**Indicates that synovial histopathology scores of IL-1 ra-treated ACLT animals were significantly higher than control animals (p<0.001).
Urinary CTXII (uCTXII) levels, adjusted to urinary creatinine in urines collected over a 24 hour period in control animals (n=5) or at 5 weeks post-ACLT treatment with PBS (n=10) or IL-1 ra (n=13). Individual data points are presented and the median value is highlighted with an “X”.
*Indicates that uCTXII levels in PBS-treated ACLT animals were significantly higher than uCTXII levels in control or IL-1 ra treated ACLT animals (p<0.001).

Representative cleaved caspase-3 (top panel), lubricin (middle panel) and MMP-13 (bottom panel) immunostained articular cartilage from controls and animals that underwent ACLT followed by intra-articular treatment with PBS (PBS), IL-1 ra (IL-1 ra), recombinant lubricin (rhPRG4) and a combination of IL-1 ra and rhPRG4 (IL-1 ra + LUB). Scale = 50 µm.
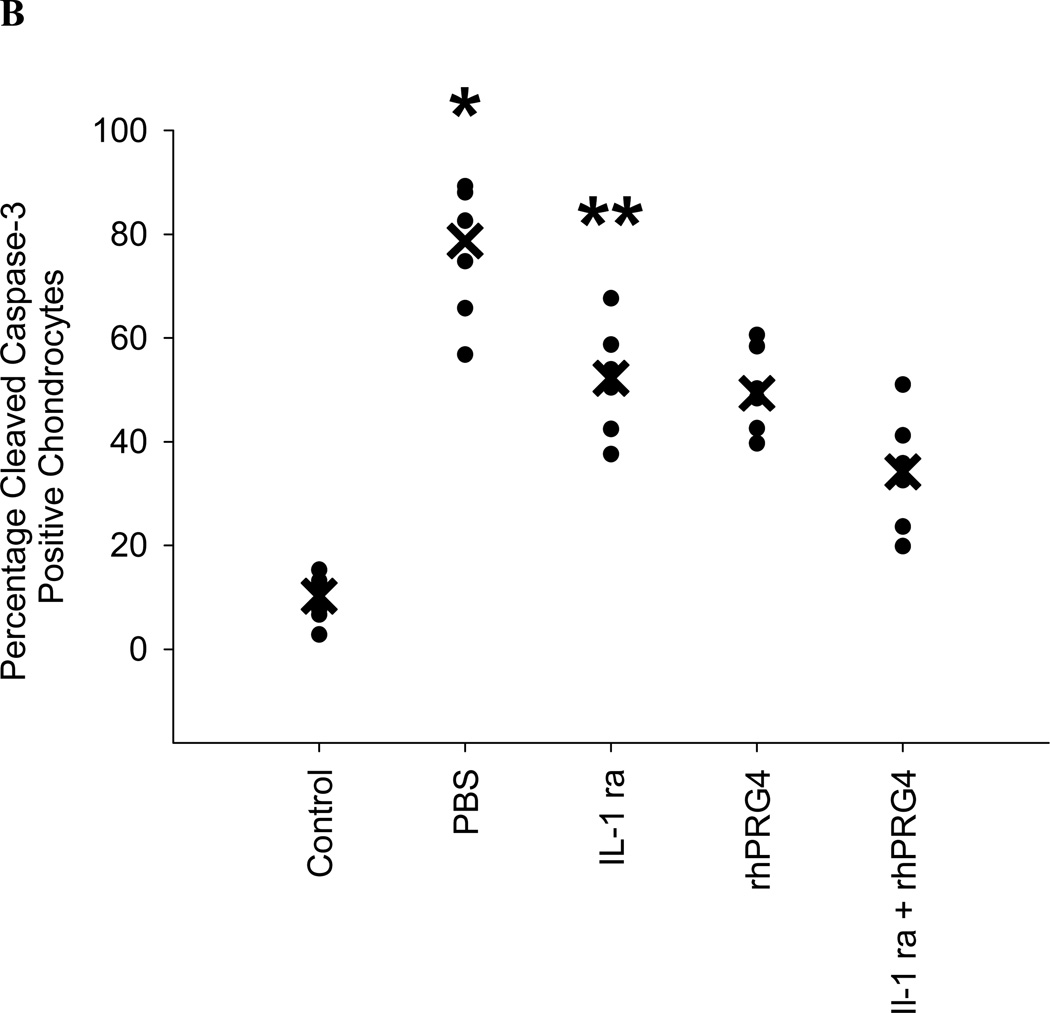
Semi-quantitative analysis of percentage of cleaved caspase-3 positive chondrocytes in controls (n=5) and ACLT animals treated with PBS, IL-1 ra, rhPRG4 or IL-1 ra + rhPRG4 (n=6 in each group). Individual data points are presented and the median value is highlighted with an “X”.
*Indicates that percentage caspase-3 positive cells in the PBS-treated animals was significantly higher than percentage caspase-3 positive cells in controls (p<0.001), IL-1 ra (p=0.003), rhPRG4 (p=0.001) and IL-1 ra + rhPRG4 (p<0.001).
**Indicates that percentage caspase-3 positive cells in the IL-1 ra-treated animals was significantly higher than percentage caspase-3 positive cells in controls (p<0.001) and IL-1 ra + rhPRG4 (p=0.039).
Representative cleaved caspase-3 (top panel), lubricin (middle panel) and MMP-13 (bottom panel) immunostained articular cartilage from controls and animals that underwent ACLT followed by intra-articular treatment with PBS (PBS), IL-1 ra (IL-1 ra), recombinant lubricin (rhPRG4) and a combination of IL-1 ra and rhPRG4 (IL-1 ra + LUB). Scale = 50 µm.
Semi-quantitative analysis of percentage of cleaved caspase-3 positive chondrocytes in controls (n=5) and ACLT animals treated with PBS, IL-1 ra, rhPRG4 or IL-1 ra + rhPRG4 (n=6 in each group). Individual data points are presented and the median value is highlighted with an “X”.
*Indicates that percentage caspase-3 positive cells in the PBS-treated animals was significantly higher than percentage caspase-3 positive cells in controls (p<0.001), IL-1 ra (p=0.003), rhPRG4 (p=0.001) and IL-1 ra + rhPRG4 (p<0.001).
**Indicates that percentage caspase-3 positive cells in the IL-1 ra-treated animals was significantly higher than percentage caspase-3 positive cells in controls (p<0.001) and IL-1 ra + rhPRG4 (p=0.039).
Similar articles
-
The impact of forced joint exercise on lubricin biosynthesis from articular cartilage following ACL transection and intra-articular lubricin's effect in exercised joints following ACL transection.Osteoarthritis Cartilage. 2012 Aug;20(8):940-8. doi: 10.1016/j.joca.2012.04.021. Epub 2012 May 8. Osteoarthritis Cartilage. 2012. PMID: 22579916
-
Prevention of cartilage degeneration and restoration of chondroprotection by lubricin tribosupplementation in the rat following anterior cruciate ligament transection.Arthritis Rheum. 2010 Aug;62(8):2382-91. doi: 10.1002/art.27550. Arthritis Rheum. 2010. PMID: 20506144 Free PMC article.
-
The impact of anterior cruciate ligament injury on lubricin metabolism and the effect of inhibiting tumor necrosis factor alpha on chondroprotection in an animal model.Arthritis Rheum. 2009 Oct;60(10):2997-3006. doi: 10.1002/art.24800. Arthritis Rheum. 2009. PMID: 19790069 Free PMC article.
-
Lubricin: a novel potential biotherapeutic approaches for the treatment of osteoarthritis.Mol Biol Rep. 2011 Jun;38(5):2879-85. doi: 10.1007/s11033-010-9949-9. Epub 2010 Jan 23. Mol Biol Rep. 2011. PMID: 20099082 Review.
-
The biology of lubricin: near frictionless joint motion.Matrix Biol. 2014 Oct;39:17-24. doi: 10.1016/j.matbio.2014.08.008. Epub 2014 Aug 27. Matrix Biol. 2014. PMID: 25172828 Review.
Cited by
-
Investigation of candidate genes for osteoarthritis based on gene expression profiles.Acta Orthop Traumatol Turc. 2016 Dec;50(6):686-690. doi: 10.1016/j.aott.2016.04.002. Epub 2016 Nov 18. Acta Orthop Traumatol Turc. 2016. PMID: 27866912 Free PMC article.
-
Lubricin/Proteoglycan 4 binds to and regulates the activity of Toll-Like Receptors In Vitro.Sci Rep. 2016 Jan 11;6:18910. doi: 10.1038/srep18910. Sci Rep. 2016. PMID: 26752378 Free PMC article.
-
Comparison of Early-Stage Knee Osteoarthritis Induced by Medial Meniscus Tear Versus Tibial Osteotomy in the Rat Model.Cartilage. 2024 Dec 5:19476035241292322. doi: 10.1177/19476035241292322. Online ahead of print. Cartilage. 2024. PMID: 39633532 Free PMC article.
-
Recombinant human PRG4 (rhPRG4) suppresses breast cancer cell invasion by inhibiting TGFβ-Hyaluronan-CD44 signalling pathway.PLoS One. 2019 Jul 30;14(7):e0219697. doi: 10.1371/journal.pone.0219697. eCollection 2019. PLoS One. 2019. PMID: 31361756 Free PMC article.
-
Articular cartilage and synovium may be important sources of post-surgical synovial fluid inflammatory mediators.Am J Transl Res. 2022 Mar 15;14(3):1640-1651. eCollection 2022. Am J Transl Res. 2022. PMID: 35422952 Free PMC article.
References
-
- Flannery CR, Hughes CE, Schumacher BL, Tudor D, Aydelotte MB, Kuettner KE, et al. Articular cartilage superficial zone protein (SZP) is homologous to megakaryocyte stimulating factor precursor and is a multifunctional proteoglycan with potential growth-promoting cytoprotective, and lubricating properties in cartilage metabolism. Biochem Biophys Res Commun. 1999;254:535–541. - PubMed
-
- Jay GD, Britt DE, Cha CJ. Lubricin is a product of megakaryocyte stimulating factor gene expression by human synovial fibroblasts. J Rheumatol. 2000;26:2454–2457. - PubMed
-
- Schmidt TA, Schumacher BL, Klein TJ, Voegtline MS, Sah RL. Synthesis of proteoglycan 4 by chondrocyte subpopulations in cartilage explants, monolayer cultures, and resurfaced cartilage cultures. Arthritis Rheum. 2004;50:2849–2857. - PubMed
-
- Schmidt TA, Gastelum NS, Nguyen QT, Schumacher BL, Sah RL. Boundary lubrication of articular cartilage; role of synovial fluid constituents. Arthritis Rheum. 2007;56:882–891. - PubMed
-
- Jones AR, Flannery CR. Bioregulation of lubricin expression by growth factors and cytokines. Eur Cell Mater. 2007;13:40–45. - PubMed
Publication types
MeSH terms
Substances
Grants and funding
LinkOut - more resources
Full Text Sources
Other Literature Sources
Research Materials
