

Advanced magnetic resonance imaging methods for planning and monitoring radiation therapy in patients with high-grade glioma
- PMID: 25219809
- PMCID: PMC4876711
- DOI: 10.1016/j.semradonc.2014.06.008
Advanced magnetic resonance imaging methods for planning and monitoring radiation therapy in patients with high-grade glioma
Abstract
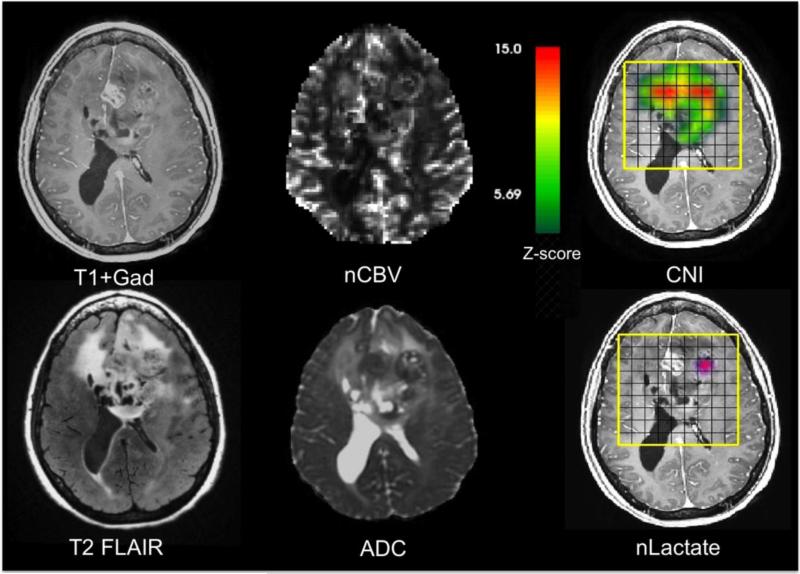
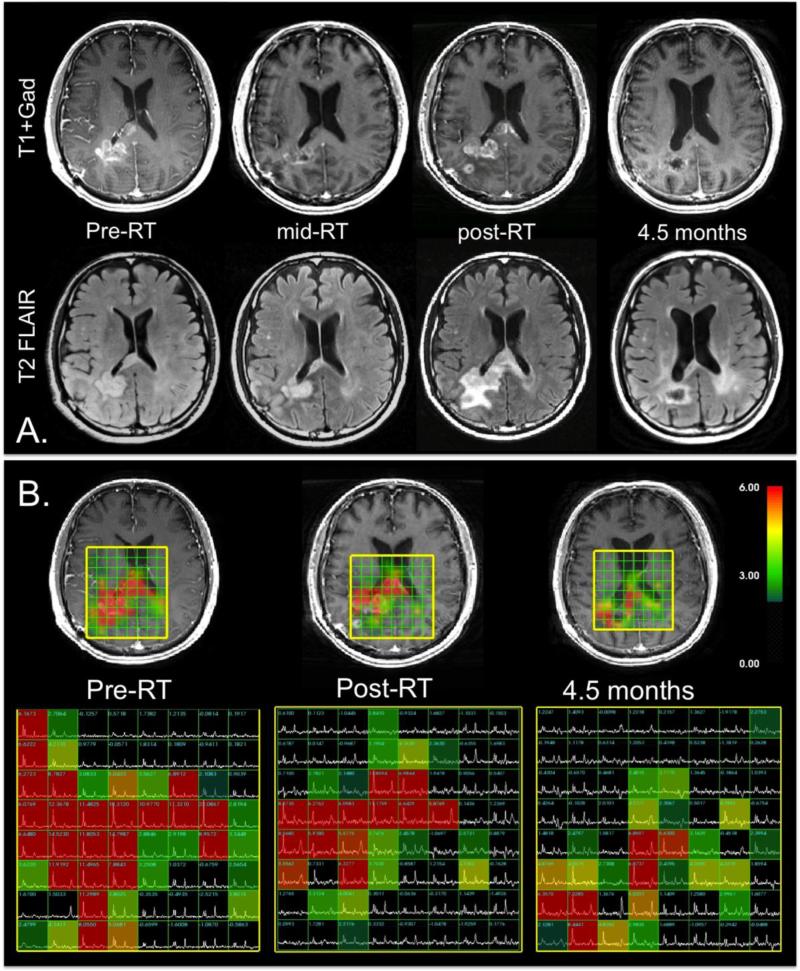
This review explores how the integration of advanced imaging methods with high-quality anatomical images significantly improves the characterization, target definition, assessment of response to therapy, and overall management of patients with high-grade glioma. Metrics derived from diffusion-, perfusion-, and susceptibility-weighted magnetic resonance imaging in conjunction with magnetic resonance spectroscopic imaging, allows us to characterize regions of edema, hypoxia, increased cellularity, and necrosis within heterogeneous tumor and surrounding brain tissue. Quantification of such measures may provide a more reliable initial representation of tumor delineation and response to therapy than changes in the contrast-enhancing or T2 lesion alone and have a significant effect on targeting resection, planning radiation, and assessing treatment effectiveness. In the long term, implementation of these imaging methodologies can also aid in the identification of recurrent tumor and its differentiation from treatment-related confounds and facilitate the detection of radiationinduced vascular injury in otherwise normal-appearing brain tissue.
Figures
Similar articles
-
Magnetic resonance spectroscopy guided brain tumor resection: differentiation between recurrent glioma and radiation change in two diagnostically difficult cases.Can J Neurol Sci. 1998 Feb;25(1):13-22. doi: 10.1017/s0317167100033436. Can J Neurol Sci. 1998. PMID: 9532276
-
Glioma recurrence versus radiation necrosis? A pilot comparison of arterial spin-labeled, dynamic susceptibility contrast enhanced MRI, and FDG-PET imaging.Acad Radiol. 2010 Mar;17(3):282-90. doi: 10.1016/j.acra.2009.10.024. Epub 2010 Jan 12. Acad Radiol. 2010. PMID: 20060750
-
Differentiation between radiation-induced brain injury and glioma recurrence using 3D pCASL and dynamic susceptibility contrast-enhanced perfusion-weighted imaging.Radiother Oncol. 2018 Oct;129(1):68-74. doi: 10.1016/j.radonc.2018.01.009. Epub 2018 Feb 2. Radiother Oncol. 2018. PMID: 29398151
-
Molecular imaging based on differential protein content in differentiating glioma from radiation necrosis.Neurosurgery. 2011 Jun;68(6):N16-7. doi: 10.1227/01.neu.0000398208.56326.19. Neurosurgery. 2011. PMID: 21778943 Review. No abstract available.
-
Treatment-related change versus tumor recurrence in high-grade gliomas: a diagnostic conundrum--use of dynamic susceptibility contrast-enhanced (DSC) perfusion MRI.AJR Am J Roentgenol. 2012 Jan;198(1):19-26. doi: 10.2214/AJR.11.7417. AJR Am J Roentgenol. 2012. PMID: 22194475 Review.
Cited by
-
Cranial fixation plates in cerebral magnetic resonance imaging: a 3 and 7 Tesla in vivo image quality study.MAGMA. 2016 Jun;29(3):389-98. doi: 10.1007/s10334-016-0548-1. Epub 2016 Mar 30. MAGMA. 2016. PMID: 27026243
-
A longitudinal magnetic resonance elastography study of murine brain tumors following radiation therapy.Phys Med Biol. 2016 Aug 21;61(16):6121-31. doi: 10.1088/0031-9155/61/16/6121. Epub 2016 Jul 27. Phys Med Biol. 2016. PMID: 27461395 Free PMC article.
-
Kill-painting of hypoxic tumours in charged particle therapy.Sci Rep. 2015 Nov 24;5:17016. doi: 10.1038/srep17016. Sci Rep. 2015. PMID: 26596243 Free PMC article.
-
Magnetic resonance spectroscopic imaging in gliomas: clinical diagnosis and radiotherapy planning.BJR Open. 2020 Apr 6;2(1):20190026. doi: 10.1259/bjro.20190026. eCollection 2020. BJR Open. 2020. PMID: 33178960 Free PMC article. Review.
-
MRI combined with PET-CT of different tracers to improve the accuracy of glioma diagnosis: a systematic review and meta-analysis.Neurosurg Rev. 2019 Jun;42(2):185-195. doi: 10.1007/s10143-017-0906-0. Epub 2017 Sep 16. Neurosurg Rev. 2019. PMID: 28918564 Free PMC article.
References
-
- Stupp R, Mason WP, van den Bent MJ, et al. Radiotherapy plus concomitant and adjuvant temozolomide for glioblastoma. N Engl J Med. 2005;352:987–96. - PubMed
-
- Brandsma D, Stalpers L, Taal W, et al. Clinical features, mechanisms, and management of pseudoprogression in malignant gliomas. Lancet Oncol. 2008;9:453–61. - PubMed
-
- Chamberlain MC, Glantz MJ, Chalmers L, et al. Early necrosis following concurrent Temodar and radiotherapy in patients with glioblastoma. J Neurooncol. 2007;82:81–3. - PubMed
Publication types
MeSH terms
Grants and funding
LinkOut - more resources
Full Text Sources
Other Literature Sources
Medical
