. 2014 Sep 18;41(3):414-426.
doi: 10.1016/j.immuni.2014.08.007. Epub 2014 Sep 11.

Distinct contributions of Aire and antigen-presenting-cell subsets to the generation of self-tolerance in the thymus

Affiliations

Distinct contributions of Aire and antigen-presenting-cell subsets to the generation of self-tolerance in the thymus

Justin S A Perry et al. Immunity. .

Abstract

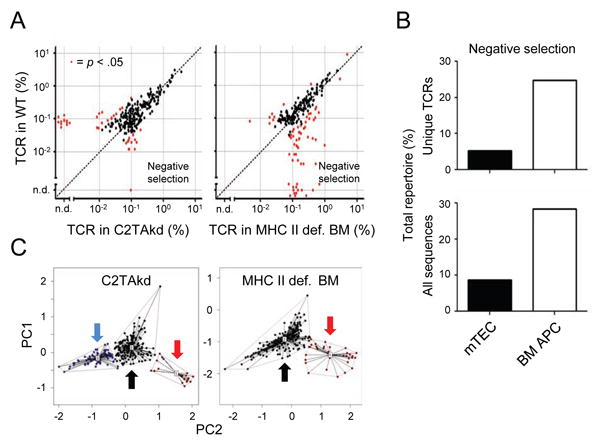
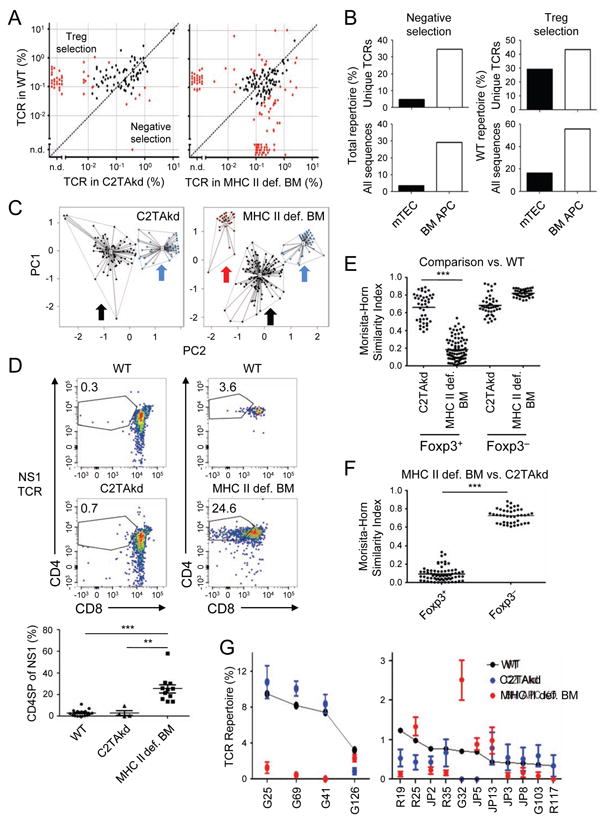
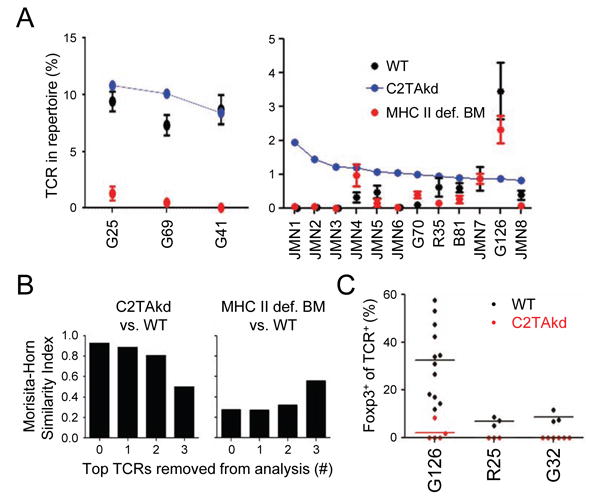
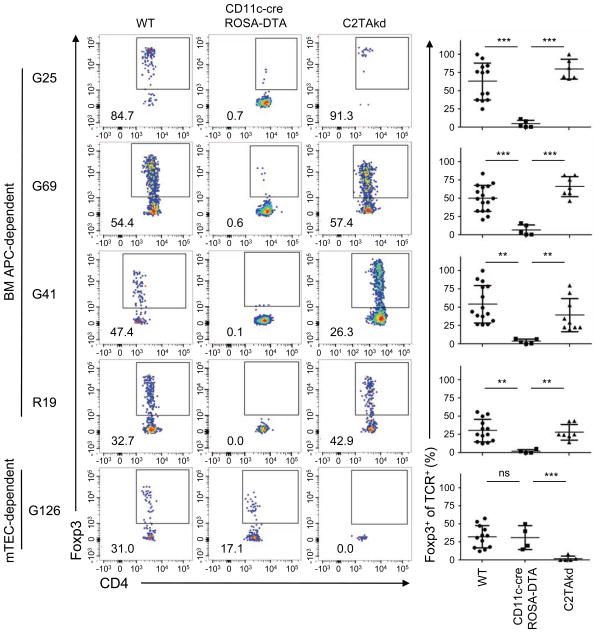
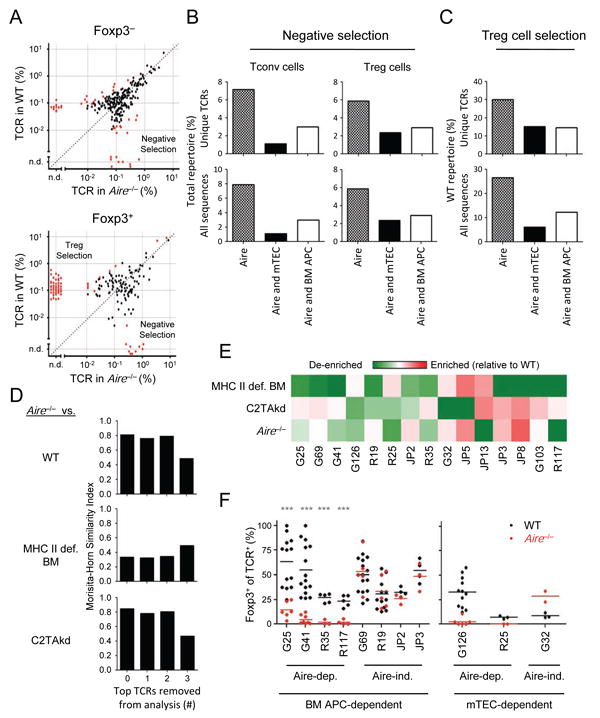
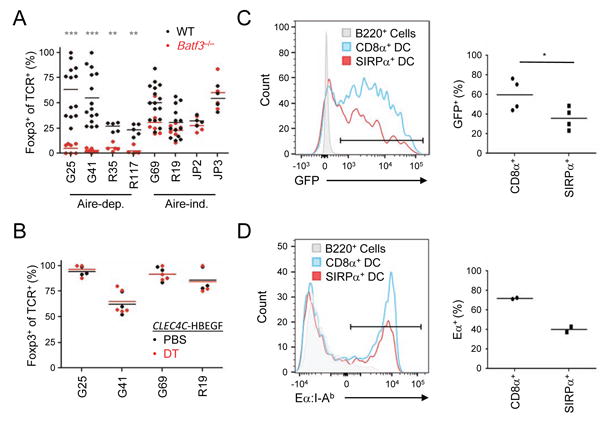
The contribution of thymic antigen-presenting-cell (APC) subsets in selecting a self-tolerant T cell population remains unclear. We show that bone marrow (BM) APCs and medullary thymic epithelial cells (mTECs) played nonoverlapping roles in shaping the T cell receptor (TCR) repertoire by deletion and regulatory T (Treg) cell selection of distinct TCRs. Aire, which induces tissue-specific antigen expression in mTECs, affected the TCR repertoire in a manner distinct from mTEC presentation. Approximately half of Aire-dependent deletion or Treg cell selection utilized a pathway dependent on antigen presentation by BM APCs. Batf3-dependent CD8α⁺ dendritic cells (DCs) were the crucial BM APCs for Treg cell selection via this pathway, showing enhanced ability to present antigens from stromal cells. These results demonstrate the division of function between thymic APCs in shaping the self-tolerant TCR repertoire and reveal an unappreciated cooperation between mTECs and CD8α⁺ DCs for presentation of Aire-induced self-antigens to developing thymocytes.


Figures

Figure 1
Figure 1. BM APCs and mTECs mediate negative selection of conventional T cells
(A) Changes in Tconv TCR frequency with manipulation of MHC II expression on BM APCs or mTECs. Data shown are the frequency of Foxp3 CD4SP TCRs in MHC II deficient (def.) BM or C2TAkd versus control chimeras. Red dots indicate significant differences in TCR frequency (p < .05, Mann-Whitney U). (B) Summary of effects on the Tconv cell TCR repertoire with modulating MHC II expression on mTECs or BM APCs. Data shown are the percentage of unique TCRs (top) or total sequences (bottom) in the filtered data set that are negatively selected based on a statistically significant effect and ≥ 80% decrease in WT frequency. (C) PCA of TCR frequencies. Red dots/arrow form a cluster of TCRs (variances: MHC II def. BM = 27.5%, C2TAkd = 11.1%) that correlate with, but are not necessarily identical to, the negatively selected TCRs in (A). Similarly, black dots/arrow represents TCRs unaffected by deficiency of MHC II in a given APC, and blue dots/arrow represent TCRs enriched in WT mice relative to C2TAkd mice (variance = 12.6%). Centroids represent the middle of a given cluster. A shorter line represents greater similarity to the centroid. Data represent three independent experiments with 2-3 replicates per experiment. See also Figure S1.
Figure 2
Figure 2. Role of BM APCs and mTECs in thymic Treg cell selection
(A) Changes in Treg cell TCR frequency with manipulation of MHC II expression on BM APCs or mTECs. Data shown are the frequency of Foxp3+ CD4SP TCRs in MHC II def. BM or C2TAkd versus control chimeras as per Figure 1A. (B) Summary of effects on the Treg cell TCR repertoire with modulating MHC II on mTECs or BM APCs. Data shown are the percentage of unique TCRs (top) or total sequences (bottom) in the filtered data set that are interpreted to undergo APC-dependent negative selection (left), or Treg cell selection (right), based on statistical significance and ≥ 80% percent change in frequency versus WT. Note that negative selection is based on all of the TCRs in a given plot in (A), whereas Treg cell selection represents the frequency of the WT repertoire that is dependent on the indicated APC to avoid incorporating effects of negative selection. (C) PCA of TCR frequencies. Like Figure 1C, red dots/arrow correlate with negatively selected TCRs (variances: MHC II def. BM = 17.5%, C2TAkd = 11.6%), black dots/arrow unaffected TCRs, and blue dots/arrow Treg TCRs (variances: MHC II def. BM = 41.6%, C2TAkd = 28.0%). (D) BM APCs negatively select TCR NS1 in vivo. Data shown are representative flow cytometry plots (top) and summary (bottom) of intrathymic injection of Rag 1-/-thymocytes retrovirally-transduced with NS1 and transferred into WT versus C2TAkd (left) or WT versus MHC II def. BM (right) chimeric mice (data pooled from at least two independent experiments with 2 replicates per experiment). ***p < .001, Mann-Whitney U. (E, F) Morisita-Horn similarity analysis of Treg and Tconv cell TCR repertoires. In (E), the TCR repertoire from each MHC manipulation is compared with the WT repertoire, whereas in (F) the comparison is between the MHC II def. BM APC and C2TAkd repertoires. An index value of 1 indicates that the two samples are completely similar whereas an index value of 0 means they are completely dissimilar. (G) Analysis of individual Treg cell TCRs from the WT condition. The top 15 individual Foxp3+ CD4SP TCRs from aggregated WT data sets are shown sorted by frequency, along with the corresponding frequency in the C2TAkd or MHC II def. BM Treg TCR repertoires. See also Figure S2.
Figure 3
Figure 3. mTECs select a substantial portion of the thymus-derived Treg repertoire
(A) Analysis of individual Treg cell TCRs from C2TAkd chimeras. The top 15 Foxp3+ TCRs in the C2TAkd dataset are shown sorted by frequency, along with the corresponding frequency in the WT and MHC II def. BM datasets. (B) Change in Morisita-Horn index with removal of most common TCRs. Similarity between Foxp3+ TCR repertoires of C2TAkd versus WT (left) and MHC II def. BM APC versus WT (right) were assessed after removing the top 1, 2, or 3 highest frequency WT TCRs from the analysis. (C) In vivo validation of Treg cell TCRs dependent on mTEC antigen presentation. Three high frequency mTEC-dependent Treg TCRs were identified by sequencing, including G126, a common C2TAkd Treg TCR reduced in frequency in comparison with WT (Figure 3A). TCR-expressing Rag1-/- thymocytes were injected into the thymi of WT or C2TAkd hosts and analyzed at ∼ 2.5 weeks for Foxp3 expression by flow cytometry by gating on CD45.1+ CD45.2″ Va2+ CD4SP cells. Data were pooled from at least two independent experiments with 2 replicates per experiment. See also Figure S3.
Figure 4
Figure 4. Thymus-derived Treg selection is primarily dependent on CD11c+ dendritic cells
The top 5 WT Treg cell TCRs, of which the top 4 are BM APC-dependent, were retrovirally transduced into Rag1–/– thymocytes, which were intrathymically injected into WT, CD11c-Cre ROSA-DTA, or C2TAkd hosts. Data shown are representative flow cytometry plots (left) and summary graphs (right) with each dot representing the data from one host. Each TCR was analyzed in at least 2 independent experiments with 2-3 replicates. **p < .01, ***p < .001, ns = not significant (Mann-Whitney U). See also Figure S4.
Figure 5
Figure 5. Aire selects a subset of thymic Treg cells
(A) Changes in TCR frequency with Aire. The frequencies of Foxp3 (top panel) and Foxp3+ (bottom panel) TCRs in WT and Aire–/– mice are plotted as per Figure 1A and 2A. Red dots indicate TCRs that are significantly different by Mann-Whitney U (p < .05). (B, C) Summary of the effects of Aire on the TCR repertoire. Data shown are the percentage of unique TCRs (top) or total sequences (bottom) interpreted to undergo Aire-dependent negative selection (B) or Treg cell selection (C), as described in Figures 1B and 2C. (D) Morisita-Horn similarity analysis of Treg cell TCR repertoires from Aire–/– versus WT mice (top), or MHC-II-def. BM (middle) or C2TAkd (bottom), with leave-one-out analysis of the highest frequency Aire–/– TCRs as per Figure 3B. (E) Analysis of the top 15 WT Treg cell TCRs for their dependence on BM APCs, mTECs, and Aire. The heatmap shows the effect of an indicated experimental condition on an individual TCR (% of TCR in condition / [% in WT + % in condition]). Values < 0.5 indicate a loss of the TCR in the condition (green color), implying that the selection of the Treg cell TCR is dependent on the condition. Red represents values > 0.5 indicating enrichment of TCR in condition relative to WT, suggestive of negative selection. (F) In vivo analysis of BM APC- and mTEC- dependent Treg cell TCRs. As per Figure 3, Treg cell differentiation in response to Aire was assessed using Rag1–/– thymocytes transduced with retrovirus expressed Treg cell TCRs showing varying dependence on Aire, BM APCs, and mTECs by TCR repertoire analysis. Each TCR was tested in at least 2 independent experiments with 1-3 replicates per experiment. Each dot represents data from a single host. Mann-Whitney U test, ***p < .001. See also Figure S5.
Figure 6
Figure 6. CD8α+ DCs preferentially acquire and present Aire-dependent antigens to developing Treg cells
(A) In vivo analysis of the role of CD8α+ DCs in Treg selection of TCRs dependent on both BM APC and Aire. As in Figure 3, Rag 1-/- thymocytes expressing TCRs were injected into the thymi of Batf3-/- or WT hosts. (B) Plasmacytoid DCs are not required for Treg cell differentiation of Aire and BM APC co-dependent Treg TCRs. As per (A), except the Treg TCRs were tested in CLEC4C-HBEGF mice treated with diphtheria toxin (120 ng/mouse) or PBS. (C) Protein transfer from radioresistant host thymic cells to CD8α+ and SIRPa+ DCs. BM chimeras of Ly5.1 (donor) into Actin-GFP (host) mice were harvested after 4 weeks, and presence of host-derived GFP in donor DCs was assessed. Representative flow cytometry histogram overlays and pooled data are shown. (D) Antigen transfer from radioresistant thymic epithelial cells to CD8α+ DCs. BM chimeras of Ly5.1 H-2b (donor) into H-2d (host) mice were harvested after 4 weeks. The presence of host-derived Ea 52-68 peptide bound to I-Ab on donor DCs was assessed using the YAe antibody. *p < .05, **p < .01, ***p < .001, ns = not significant (Mann-Whitney U). Plots shown are pooled from at least two experiments with 1-3 replicates per experiment. Each dot represents data from an individual host. See also Figure S6.

Comment in

References

    1. Aichinger M, Wu C, Nedjic J, Klein L. Macroautophagy substrates are loaded onto MHC class II of medullary thymic epithelial cells for central tolerance. The Journal of Experimental Medicine. 2013;210:287–300. - PMC - PubMed
    1. Anderson MS, Su MA. Aire and T cell development. Current Opinion in Immunology. 2011;23:198–206. - PMC - PubMed
    1. Anderson MS, Venanzi ES, Chen Z, Berzins SP, Benoist C, Mathis D. The Cellular Mechanism of Aire Control of T Cell Tolerance. Immunity. 2005;23:227–239. - PubMed
    1. Aschenbrenner K, D'Cruz LM, Vollmann EH, Hinterberger M, Emmerich J, Swee LK, Rolink A, Klein L. Selection of Foxp3+ regulatory T cells specific for self antigen expressed and presented by Aire+ medullary thymic epithelial cells. Nat Immunol. 2007;8:351–358. - PubMed
    1. Atibalentja DF, Murphy KM, Unanue ER. Functional Redundancy between Thymic CD8α+ and Sirpα+ Conventional Dendritic Cells in Presentation of Blood-Derived Lysozyme by MHC Class II Proteins. The Journal of Immunology. 2011;186:1421–1431. - PMC - PubMed

Publication types

MeSH terms