

Prevalence of multimorbidity in a geographically defined American population: patterns by age, sex, and race/ethnicity
- PMID: 25220409
- PMCID: PMC4186914
- DOI: 10.1016/j.mayocp.2014.07.010
Prevalence of multimorbidity in a geographically defined American population: patterns by age, sex, and race/ethnicity
Abstract
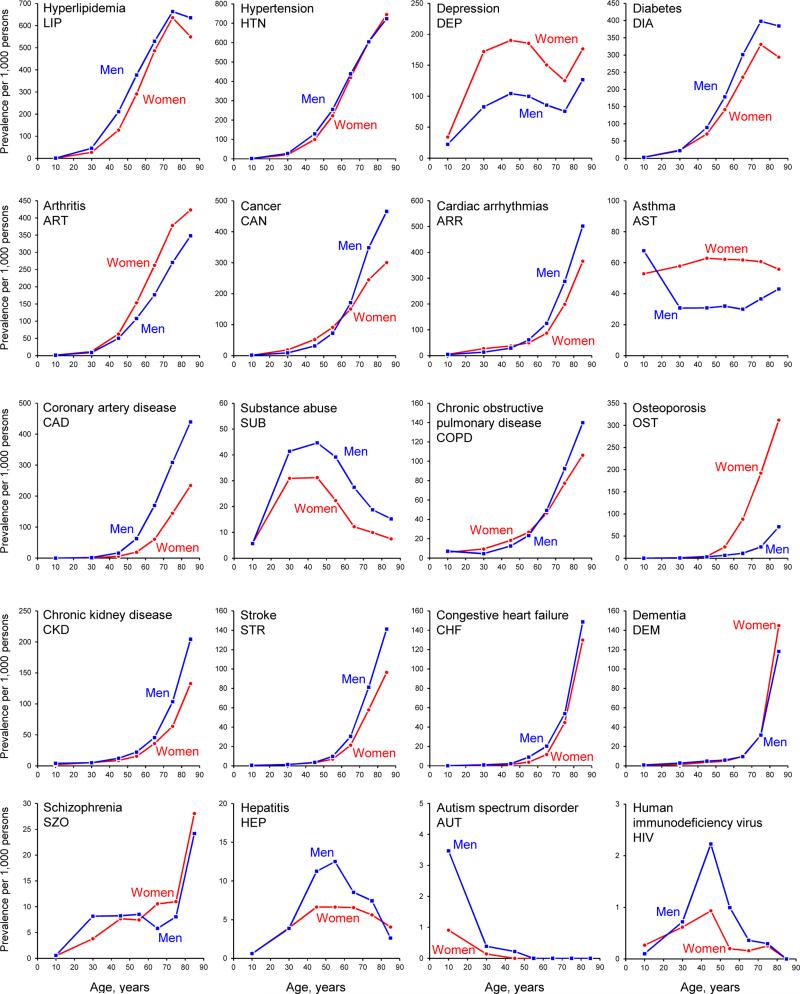
Objective: To describe the prevalence of multimorbidity involving 20 selected chronic conditions in a geographically defined US population, emphasizing age, sex, and racial/ethnic differences.
Patients and methods: Using the Rochester Epidemiology Project records linkage system, we identified all residents of Olmsted County, Minnesota, on April 1, 2010, and electronically extracted the International Classification of Diseases, Ninth Revision codes associated with all health care visits made between April 1, 2005, and March 31, 2010 (5-year capture frame). Using these codes, we defined the 20 common chronic conditions recommended by the US Department of Health and Human Services. We counted only persons who received at least 2 codes for a given condition separated by more than 30 days, and we calculated the age-, sex-, and race/ethnicity-specific prevalence of multimorbidity.
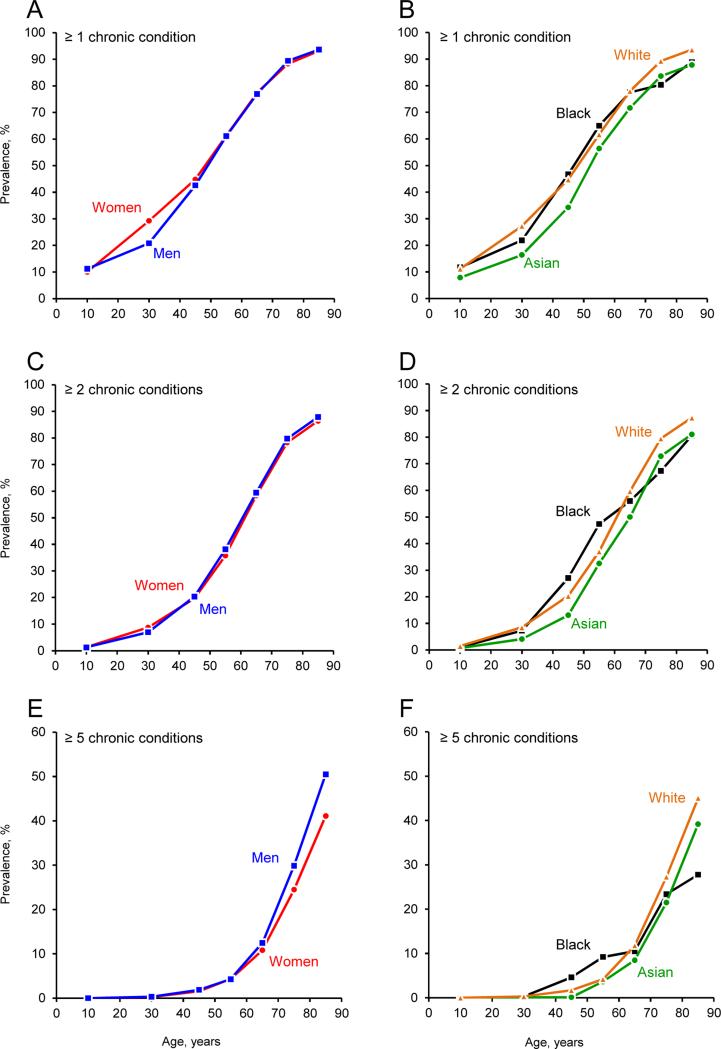
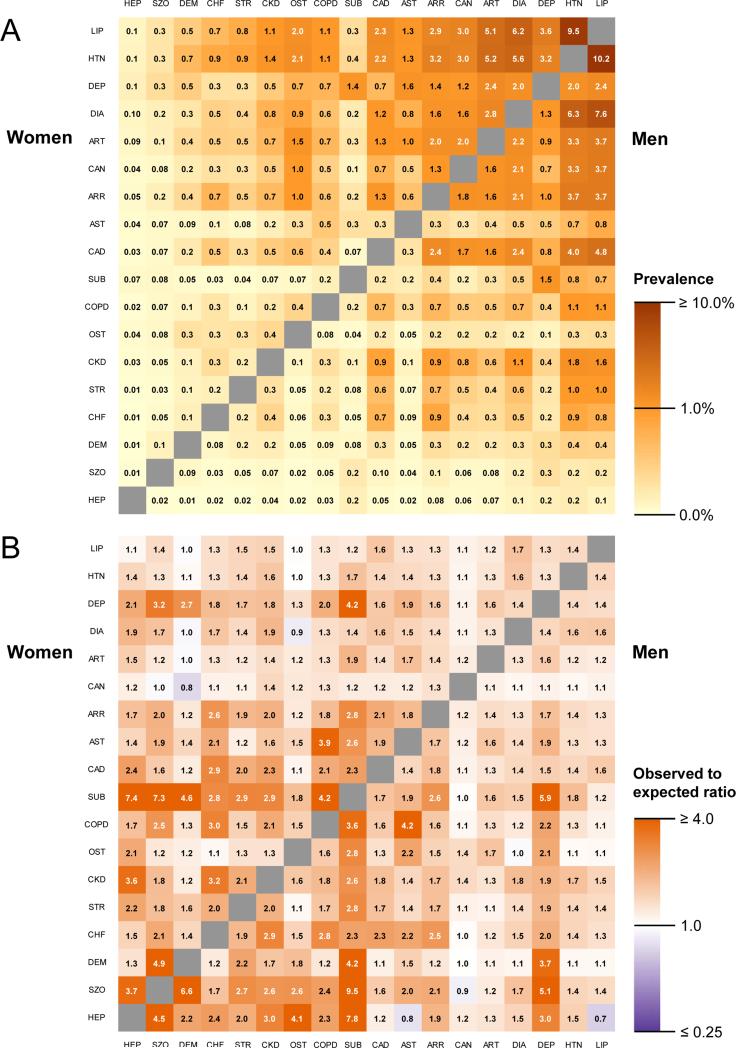
Results: Of the 138,858 study participants, 52.4% were women (n=72,732) and 38.9% had 1 or more conditions (n=54,012), 22.6% had 2 or more conditions (n=31,444), and 4.9% had 5 or more conditions (n=6853). The prevalence of multimorbidity (≥2 conditions) increased steeply with older age and reached 77.3% at 65 years and older. However, the absolute number of people affected by multimorbidity was higher in those younger than 65 years. Although the prevalence of multimorbidity was similar in men and women overall, the most common dyads and triads of conditions varied by sex. Compared with white persons, the prevalence of multimorbidity was slightly higher in black persons and slightly lower in Asian persons.
Conclusion: Multimorbidity is common in the general population; it increases steeply with older age, has different patterns in men and women, and varies by race/ethnicity.
Copyright © 2014 Mayo Foundation for Medical Education and Research. Published by Elsevier Inc. All rights reserved.
Figures
Comment in
-
Multimorbidity at the local level: implications and research directions.Mayo Clin Proc. 2014 Oct;89(10):1321-3. doi: 10.1016/j.mayocp.2014.08.007. Epub 2014 Sep 11. Mayo Clin Proc. 2014. PMID: 25220410 No abstract available.
References
-
- Boyd CM, Darer J, Boult C, Fried LP, Boult L, Wu AW. Clinical practice guidelines and quality of care for older patients with multiple comorbid diseases: implications for pay for performance. JAMA. 2005;294(6):716–724. - PubMed
-
- Hughes LD, McMurdo MET, Guthrie B. Guidelines for people not for diseases: the challenges of applying UK clinical guidelines to people with multimorbidity. Age Ageing. 2014;42(1):62–69. - PubMed
-
- U.S. Department of Health and Human Services . Multiple Chronic Conditions - A Strategic Framework: Optimum Health and Quality of Life for Individuals with Multiple Chronic Conditions. Washington, D.C.: Dec, 2010.
-
- Salive ME. Multimorbidity in Older Adults. Epidemiol Rev. 2013;35(1):75–83. - PubMed
Publication types
MeSH terms
Grants and funding
LinkOut - more resources
Full Text Sources
Other Literature Sources
Miscellaneous
