. 2014 Sep 25;8(6):1819-1831.
doi: 10.1016/j.celrep.2014.08.036. Epub 2014 Sep 15.

ARTD1/PARP1 negatively regulates glycolysis by inhibiting hexokinase 1 independent of NAD+ depletion

Affiliations

ARTD1/PARP1 negatively regulates glycolysis by inhibiting hexokinase 1 independent of NAD+ depletion

Elise Fouquerel et al. Cell Rep. .

Abstract

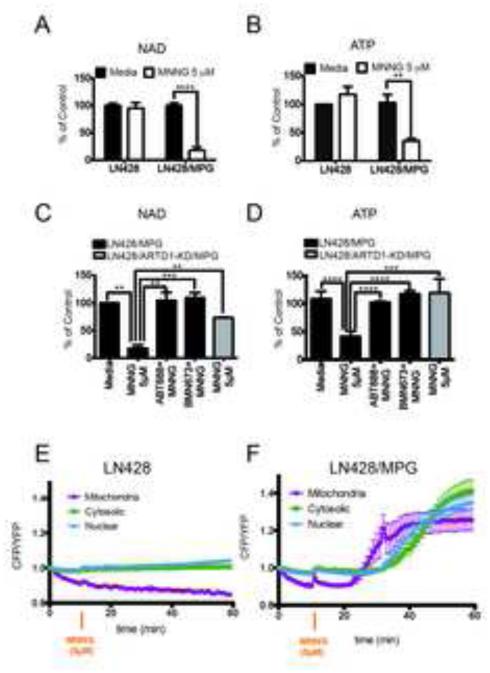
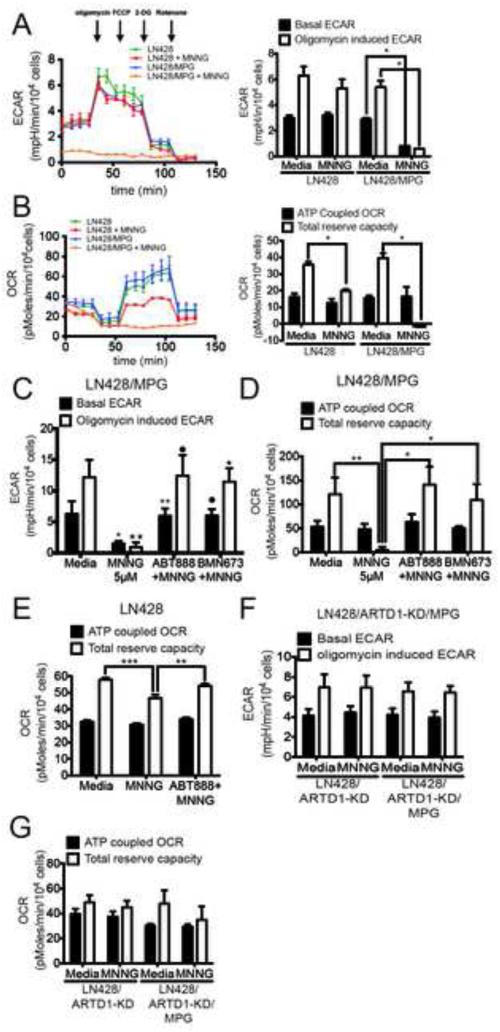
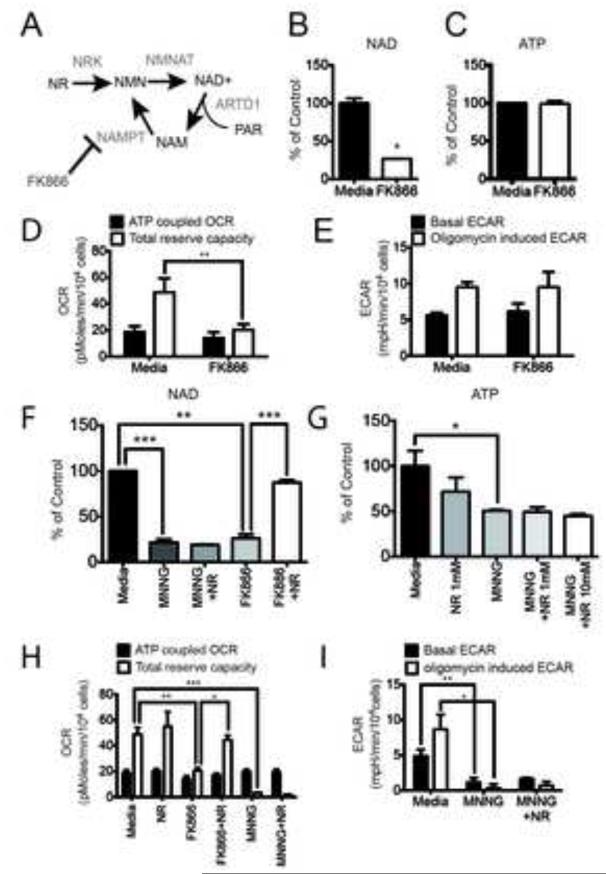
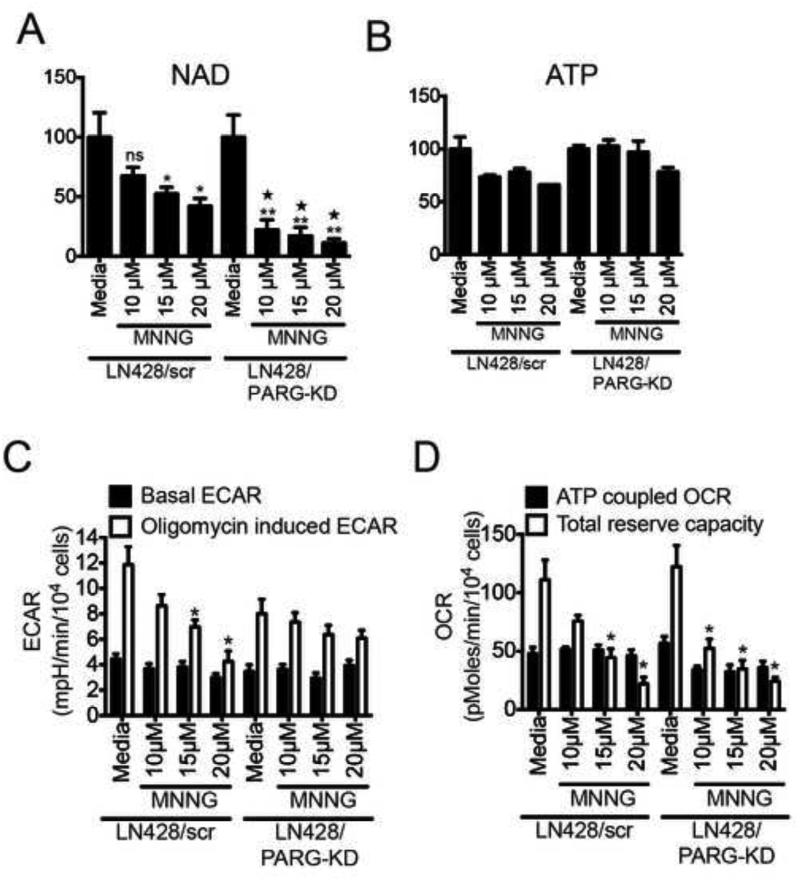
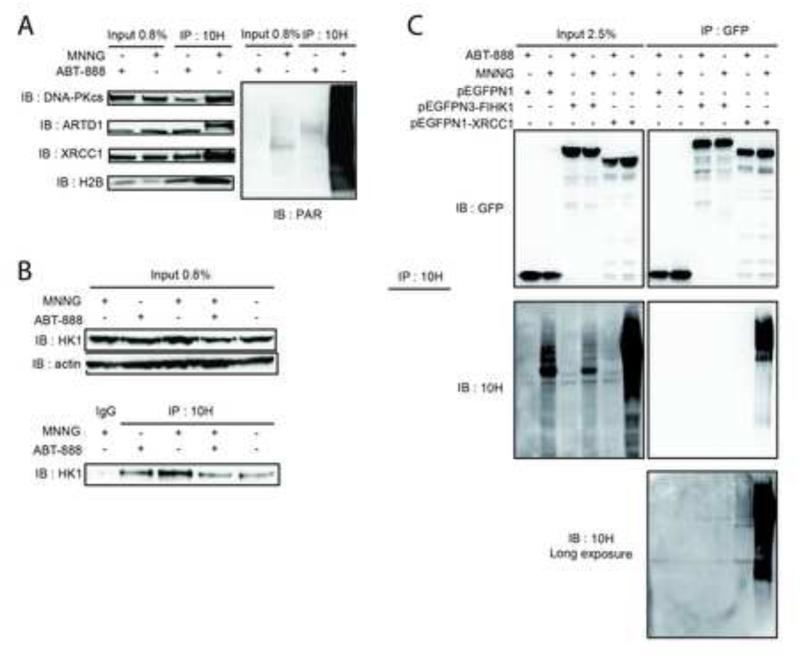
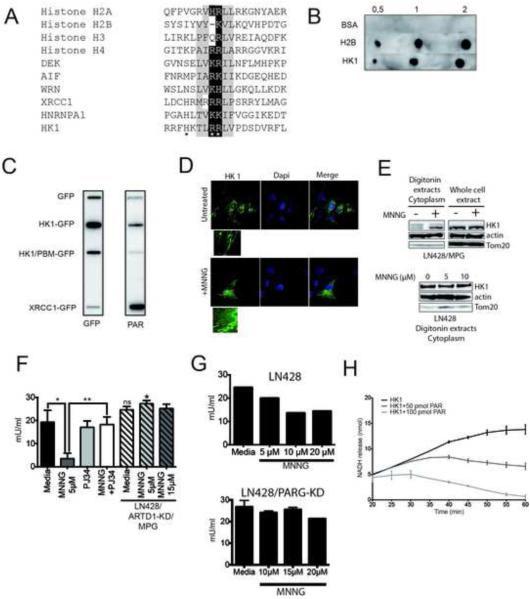
ARTD1 (PARP1) is a key enzyme involved in DNA repair through the synthesis of poly(ADP-ribose) (PAR) in response to strand breaks, and it plays an important role in cell death following excessive DNA damage. ARTD1-induced cell death is associated with NAD(+) depletion and ATP loss; however, the molecular mechanism of ARTD1-mediated energy collapse remains elusive. Using real-time metabolic measurements, we compared the effects of ARTD1 activation and direct NAD(+) depletion. We found that ARTD1-mediated PAR synthesis, but not direct NAD(+) depletion, resulted in a block to glycolysis and ATP loss. We then established a proteomics-based PAR interactome after DNA damage and identified hexokinase 1 (HK1) as a PAR binding protein. HK1 activity is suppressed following nuclear ARTD1 activation and binding by PAR. These findings help explain how prolonged activation of ARTD1 triggers energy collapse and cell death, revealing insight into the importance of nucleus-to-mitochondria communication via ARTD1 activation.


Figures

Figure 1
Figure 1. ARTD1 hyper-activation induced by DNA repair intermediates triggers energetic depletion in glioblastoma cells
(A and B) Global NAD+ (A) and global ATP (B) levels in LN428 and LN428/MPG cells after 1hr treatment with either media or 5μM MNNG. The data shown is the average of 3 independent experiments +/− SD and are reported as percentage of the untreated control cell line (LN428): (A)****p<0.0001 (B) **p=0.01. (C and D) Global NAD+ (C) and global ATP (D) levels in LN428/MPG cells (black bars) or in LN428/ARTD1-KD/MPG cells (grey bar) after a 1hr treatment with either media, 5μM MNNG or 5μM MNNG after a pre-treatment with ARTD1 inhibitors ABT-888 or BMN673, as indicated. The data shown is the average of 3 independent experiments +/− SD and are reported as percentage of the untreated cells: (C)**p<0.005, ***p=0,0003, (D) ****p<0,0001, ***p<0,001. (E and F) FRET ratio calculated in the compartments of LN428 cells (E) or LN428/MPG cells (F) transfected with the indicated FRET sensors. Images were acquired each minute. A ten-minute baseline period was recorded before cells were treated with 5μM MNNG (orange arrow). FRET traces shown are the mean of 5-7 cells (LN428) or 7-9 (LN428/MPG) +/− SE.
Figure 2
Figure 2. Mitochondrial dysfunction following alkylating agent-induced ARTD1 activation
(A and B) Seahorse extracellular flux analyser (SEFA) measurement of ECAR metabolic profile (A) or OCR metabolic profile (B) in LN428 or LN428/MPG cells treated with either media or MNNG (5μM, 1hr). Bar graphs representing basal ECAR and oligomycin induced ECAR (A) or ATP coupled OCR and total reserve capacity (TRC) (B) are shown on the right. Traces shown are the mean of two independent experiments in which each data point represents technical replicates of 5 wells each +/− SE. Basal and induced ECAR rates, ATP coupled OCR and TRC are calculated using the average of 3 data points collected for each metabolic inhibitor, +/− SD (*p<0.05). (C and D) ECAR measurements (C) and OCR measurements (D) in LN428/MPG cells treated with 5μM MNNG following pre-treatment with media control or ARTD1 inhibitors ABT-888 or BMN-673 as indicated. Shown is the mean of 3 independent experiments +/− SD as described above: (C)*p<0.05 compared to media for basal ECAR, •p<0,05 compared to MNNG for basal ECAR, **p<0.005 compared to MNNG for basal ECAR, ∗∗p<0.005 compared to media for induced ECAR, •p<0,005 compared to MNNG for induced ECAR, ∗p<0,01 compared to MNNG for induced ECAR; D*p<0.05, **p<0.01. (E) OCR measurement in LN428 cells treated with 5μM MNNG following pre-treatment with media control or ARTD1 inhibitor ABT-888. Shown is the mean of 3 independent experiments +/− SD (***p<0.0004 compared to media control for TRC, **p<0.002 compared to MNNG for TRC). (F and G) ECAR measurement (F) and OCR measurement (G) for LN428/ARTD1-KD or LN428/ARTD1-KD/MPG cells after treatment with media control or 5μM MNNG. Shown is the average of 3 independent experiments +/− SD as described above.
Figure 3
Figure 3. NAD+ depletion does not alter glycolysis in LN428/MPG cells
(A) Schematic of NAD+ biosynthesis from Nicotinamide Riboside (NR) and from recycling after ARTD1 consumption of NAD+ releasing Nicotinamide (NAM). NAM is subsequently phosphorylated by Nicotinamide Phosphoribosyl Transferase (NAMPT), an enzyme selectively inhibited by FK866. (B and C) Global NAD+ (B) and global ATP (C) measurement in LN248/MPG cells after 24hr of treatment with media or FK866 (10nM). The data shown is the average of 3 independent experiments +/− SD and are reported as percentage of the untreated cells; (B)*p<0.05. (D) Seahorse measurement of the OCR metabolic profile was performed in LN428/MPG cells treated with either media control or FK866 (10nM) for 24hr. Shown is the mean of 4 independent experiments +/− SD (**p<0.01). (E) Seahorse measurement of the ECAR metabolic profile was performed as above. Shown is the mean of 2 independent experiments +/− SD. (F) Global NAD+ level in LN428/MPG cells after either media, NR (1mM) or FK866 (10nM) with or without NR (1mM) as a 24hr pre-treatment. Cells treated by MNNG, and pretreated or not by NR, are incubated 1hr with MNNG prior the analysis (***p<0.0005, **p<0.001). (G) Global ATP levels after 24hr treatment with either media (black bar) or NR (1mM) (dark grey bar), or NR (10mM) followed by media alone or media supplemented with MNNG (5μM, 1hr) (dark-grey, light-grey and white bars) (*p<0.05). (H) OCR metabolic profile of LN428/MPG cells treated with either media control or NR (1mM) and/or FK866 (10nM) followed by media alone or media supplement with MNNG (5μM, 1hr). Data shown is the mean of four independent experiments +/− SD (***p<0.005, **p<0.01, *p<0.05). (I) ECAR profile of LN428/MPG cells treated with either media or media supplemented with 1mM NR for 24hr followed by a 1hr treatment with MNNG. Data shown is the mean of three independent experiments +/− SD (**p<0.01, *p<0.05).
Figure 4
Figure 4. Absence of PARG rescues loss of ATP and glycolytic defects in LN428 cells after high dose MNNG treatment
(A and B) Global NAD+ (A) and global ATP (B) measured in LN428/scr and LN428/PARG-KD cells after 1hr exposure to increasing doses of MNNG. Shown is the mean of 3 independent experiments (ns, non significant; *p<0.04 compared to media treated LN428/scr cells; **p<0,01 compared to media treated LN428/PARG-KD cells; ∗p<0.005 compared to each respective dose of MNNG in LN428/scr cells). (C and D) Seahorse measurement of ECAR metabolic profile (C) and OCR metabolic profile (D) of LN428/scr or LN428/PARG-KD cells treated with either media or MNNG (1hr) at 10μM, 15μM and 20μM. Shown is the mean of 3 independent experiments +/− SD (*p<0,05).
Figure 5
Figure 5. Affinity-purification and analysis of PAR-containing complexes
(A) Validation by IP/immunoblot of DNA-PKcs, ARTD1, XRCC1 and H2B identified in the mass spectrometry analysis. Left panel is IP with the anti-PAR Ab 10H and immunoblot with the indicated antibodies; right panel is immunoblot for PAR after IP with the anti-PAR (10H) Ab. (B) Validation by IP/immunoblot of HK1 enzyme identified in the mass spectrometry analysis as described in (A). (C) Upper panel is the GFP immunoblot on inputs and IP samples after pull-down of GFP-tagged proteins with GFP-Trap. Cells are treated either with the ARTD1 inhibitor ABT-888 (10μM; 30min) or with MNNG (5μM; 5min). Lower panel is PAR immunoblot on inputs and IPs samples. PAR immunoblot on IPs samples is shown as short and long exposures.
Figure 6
Figure 6. MNNG-mediated ARTD1 activation leads to hexokinase 1 release from the mitochondria and loss of activity
(A) Alignment of the PAR Binding domains (PBM) of histone H2A, H2B, H3, H4, DEK, AIF, WRN, XRCC1, HNRNPA1 and HK1 with the consensus PBM identified previously (Gagne et al., 2008; Pleschke et al., 2000). *indicates the amino acids in the putative PBM of HK1 mutated to alanine, A. (B) PAR dot blot performed with 0.5, 1 or 2μg BSA, histone H2B or HK1, as indicated. Shown is a one experiment among 4 performed independently. (C) PAR overlay performed by slot blot. Each protein was expressed in LN428 cells as a fusion with EGFP and isolated using GFP-Trap. The isolated proteins were bound to the membrane and incubated either with a GFP antibody (left panel) or PAR (right panel) followed by incubation with the anti-PAR (10H) antibody. (D) Immuno-detection by immunofluorescence of EGFP-tagged HK1 in LN428/MPG cells treated for 1hr with media or MNNG (5μM). (E) HK1 is released from the mitochondria, into the cytoplasm, after MNNG treatment. Immunoblot of endogenous HK1 in LN428/MPG cytosolic extracts (upper panel). Lower panel is the cytosolic extracts of LN428 cells performed after 1hr treatment with 0, 5 or 10μM MNNG. Actin is shown as a loading control and Tom20 as a control to demonstrate the absence of mitochondrial proteins. (F and G) Specific HK1-acitivity measurement in LN428/MPG (plain bars) and LN428/ARTD1-KD/MPG cells (hatched bars) (F) or LN428 (upper panel) and LN428/PARG-KD cells (lower panel) (G). LN428/MPG cells are pre-treated (1hr) with either media (black bar) or PJ34 (2μM) (light-grey bar) prior to MNNG treatment (dark-grey and white bars). Shown is the mean of 3 independent experiments +/− SD (**p<0.005, *p<0.05). LN428/ARTD1-KD/MPG cells are treated (1hr) with MNNG (5μM, hatched light-grey bar and 15μM, hatched dark-grey bar) (ns: non significant compared to LN428/MPG cells untreated, *p<0,05 compared to MNNG treated LN428/MPG cells). LN428 and LN428/PARG-KD cells were treated with 5μM, 10μM and 20μM MNNG (1hr). (H) PAR binding leads to HK1 activity decrease in vitro. HK1 activity is measured in vitro 20min after incubation of 0.25μg of HK1 with in vitro synthesized PAR (50pmol or 100pmol), using an HK1 colorimetric assay. Data shown is the mean of two independent experiments +/− SD.

References

    1. Alano CC, Garnier P, Ying W, Higashi Y, Kauppinen TM, Swanson RA. NAD+ depletion is necessary and sufficient for poly(ADP-ribose) polymerase-1-mediated neuronal death. J Neurosci. 2010;30:2967–2978. - PMC - PubMed
    1. Alano CC, Ying W, Swanson RA. Poly(ADP-ribose) polymerase-1-mediated cell death in astrocytes requires NAD+ depletion and mitochondrial permeability transition. J Biol Chem. 2004;279:18895–18902. - PubMed
    1. Almeida KH, Sobol RW. A unified view of base excision repair: lesion-dependent protein complexes regulated by post-translational modification. DNA Repair. 2007;6:695–711. - PMC - PubMed
    1. Ame JC, Hakme A, Quenet D, Fouquerel E, Dantzer F, Schreiber V. Detection of the nuclear poly(ADP-ribose)-metabolizing enzymes and activities in response to DNA damage. Methods Mol Biol. 2009;464:267–283. - PubMed
    1. Andrabi SA, Dawson TM, Dawson VL. Mitochondrial and nuclear cross talk in cell death: parthanatos. Ann N Y Acad Sci. 2008;1147:233–241. - PMC - PubMed

Publication types