. 2014 Oct 1;84(1):202-213.
doi: 10.1016/j.neuron.2014.08.037. Epub 2014 Sep 11.

Visual cortex modulates the magnitude but not the selectivity of looming-evoked responses in the superior colliculus of awake mice

Affiliations

Visual cortex modulates the magnitude but not the selectivity of looming-evoked responses in the superior colliculus of awake mice

Xinyu Zhao et al. Neuron. .

Abstract

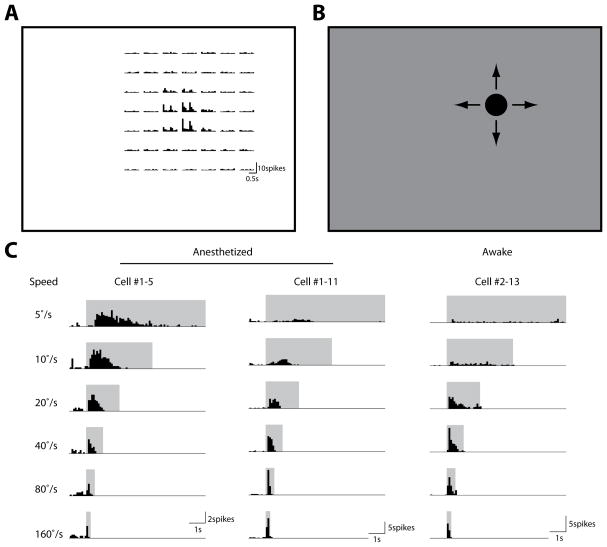
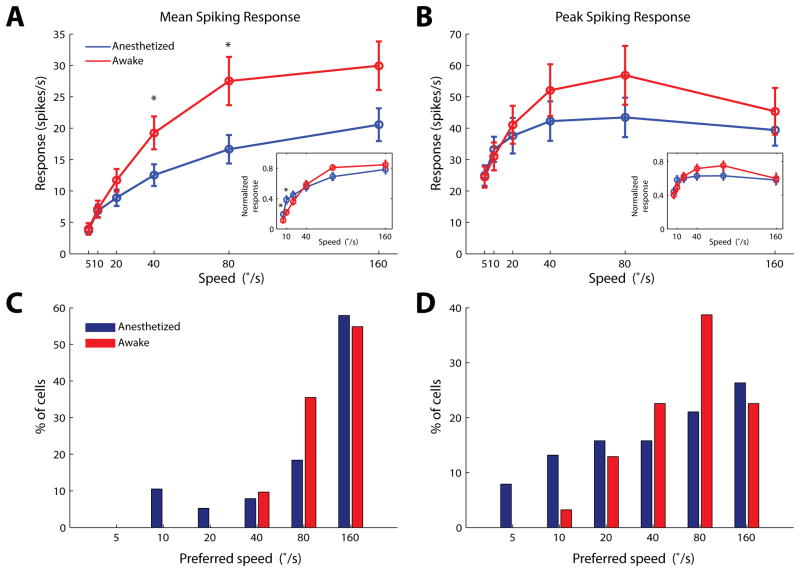
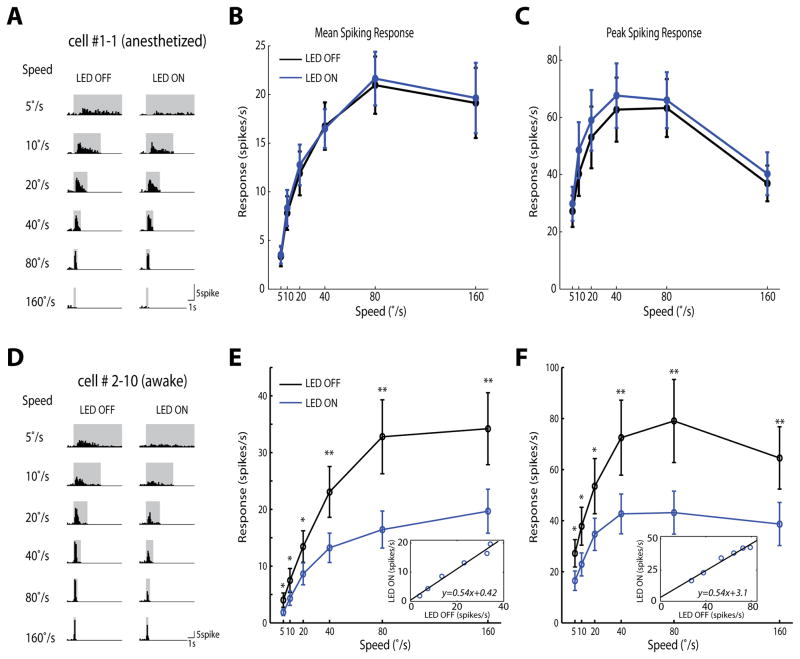
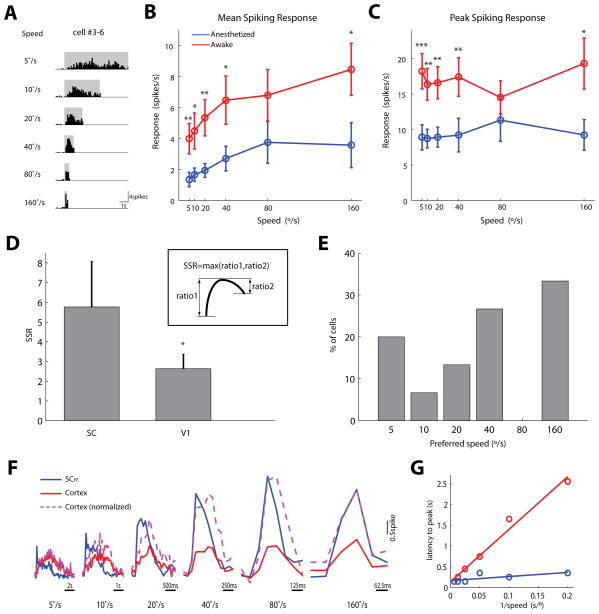
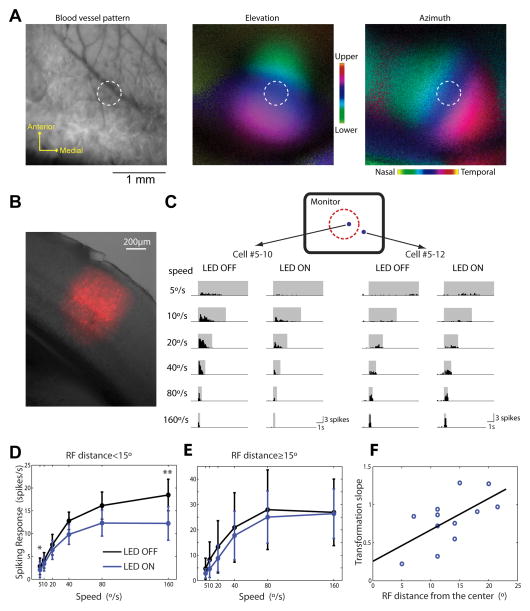
Neural circuits in the brain often receive inputs from multiple sources, such as the bottom-up input from early processing stages and the top-down input from higher-order areas. Here we study the function of top-down input in the mouse superior colliculus (SC), which receives convergent inputs from the retina and visual cortex. Neurons in the superficial SC display robust responses and speed tuning to looming stimuli that mimic approaching objects. The looming-evoked responses are reduced by almost half when the visual cortex is optogenetically silenced in awake, but not in anesthetized, mice. Silencing the cortex does not change the looming speed tuning of SC neurons, or the response time course, except at the lowest tested speed. Furthermore, the regulation of SC responses by the corticotectal input is organized retinotopically. This effect we revealed may thus provide a potential substrate for the cortex, an evolutionarily new structure, to modulate SC-mediated visual behaviors.


Figures

Figure 1
Figure 1. Neuronal responses to looming stimuli in the mouse superior colliculus
(A) Receptive field mapping of an example cell. Small squares (5°×5°) were flashed On and Off at different locations on the stimulus monitor (represented by rectangle). The peristimulus timing histograms of the evoked spikes were shown for corresponding stimulus locations (bin width: 100ms). (B) Looming circles were presented at the cell’s receptive field center. (C) Looming-evoked spike histograms of example cells in anesthetized (left and middle) and awake (right) mice (bin width: 100ms). Stimulus durations were marked by the shaded areas. In anesthetized mice, some cells preferred low looming speeds (left), while most preferred high speeds (middle). Almost all cells preferred high speeds in awake mice (right).
Figure 2
Figure 2. Speed selectivity of SC cells to looming stimuli
(AB) Population response of SC cells in anesthetized (n=38 cells, 13 mice, blue) and awake (n=31, 12 mice, red) mice, quantified by either mean (A) or peak (B) responses. Responses in the awake SC were systematically higher than that in the anesthetized condition. The difference is statistically significant (p<0.05, Mann-Whitney test) for mean responses at speeds of 40 and 80°/s (A). Insets: Normalized SC responses. The response of each cell was first normalized by the response to its preferred speed. Normalized responses were then averaged across the population. The normalized tuning curves were moderately skewed toward higher speeds in awake animals (p<0.05, Mann-Whitney test, for speeds of 5 and 10°/s in the inset of A). (CD) Distributions of the preferred speed for individual neurons, analyzed by mean (C) or peak (D) responses. The distribution quantified by peak responses was moderately right shifted in awake mice (p=0.06, χ2 test). Pooled data were presented as mean ± S.E.M.
Figure 3
Figure 3. Silencing visual cortex reduces the gain of looming-evoked responses in the SC in awake mice
(A) Spike histogram of an example SC cell in anesthetized mice, with the LED light OFF for the control and LED ON for silencing cortex (bin width: 100ms). Changes were barely seen at any speed. (BC) Silencing cortex (blue) did not alter mean (B) or peak (C) responses in anesthetized mice, compared to the control condition (black) (n=18 cells, 6 mice). (DF) Same plots as in AC, but in awake mice. Silencing cortex significantly reduced mean and peak responses of SC cells across all tested stimulus speeds (*: p<0.05, **: p<0.01, paired t-test, n=15 cells, 6 mice). Insets: Linear transformation of responses between the LED ON and OFF conditions. Pooled data were presented as mean±S.E.M.
Figure 4
Figure 4. Silencing visual cortex does not alter SC speed tuning or time course in response to looming in awake mice
(AB) Preferred speed analyzed by the mean (A) and peak (B) spiking rate, respectively. Spref_weighted was calculated as described in Experimental Procedures. No significant alteration of the preferred speed was seen (p=0.77 in A and 0.56 in B, n=15, paired t-test). (C) Spontaneous spiking rates of SC cells before and after silencing cortex. A trend of slight reduction was seen, but not statistically significant in our dataset (p=0.21, n=15, paired t-test). The spontaneous spiking rates were 1.7±0.9spikes/s for control condition, and 0.8±0.5spikes/s when cortex was silenced (mean±S.E.M.). (D) Instantaneous spiking rate in the awake SC, averaged across all cells (bin width of 100ms; n = 15; black for the control, blue for silencing cortex, and light blue dashed lines for normalized blue curves to the control’s peak). The control and the peak-normalized responses after silencing cortex were only significantly different at the late phase of the lowest speed, as marked by pink shades (p<0.05, paired t-test). Note that responses to stimuli with different speeds were plotted with different time scales.
Figure 5
Figure 5. Responses of V1 layer 5 cells to looming stimuli
(A) Spike histogram of an example V1 layer 5 cell in awake mice. (BC) Mean (B) and peak (C) responses of layer 5 cells in anesthetized (blue) and awake (red) animals. Unlike SC cells, cortical cells were poorly tuned to looming speed under both conditions. The responsiveness was significantly higher in awake animals (*: p<0.05, **: p<0.01, ***: p<0.001; Mann-Whitney test, n=18 cells from 7 anesthetized and 15 cells for 7 awake mice). (D) Speed selectivity ratio (SSR) of individual cells is much higher in the SC than in V1, both recorded in awake animals (p<0.05, Mann-Whitney test, n=21 for SC and 15 for cortex). Inset: Calculation of SSR (see Supplemental Experimental Procedures for details). (E) Distribution of the preferred speed of individual V1 neurons. Peak responses were used for quantifications in both D and E. (F) Instantaneous spiking rates in the SC and V1 in awake mice, averaged across all cells (bin width of 100ms; n = 15 for both SC and V1). The blue curves are for the SC responses when cortex was silenced (SCFF), red for V1 responses, and purple dashed lines for V1 responses normalized to the peak of SCFF. (G) The latencies of peak responses plotted against the inverse of the looming speed. Straight lines were fitted by linear regression. The slope was 12.6 for V1 (blue) and 1.0 for the SCFF (red). Pooled data were presented as mean±S.E.M.
Figure 6
Figure 6. The effect of corticotectal projection is retinotopically organized
(A) Intrinsic imaging of cortical retinotopic maps for guiding viral injection. Left panel: cortical blood vessel pattern used as landmarks. Middle and right: elevation and azimuth maps in V1. Positions in the visual space were color coded as shown in the color scale. In both cases, the range (from green to red) spanned ~60° in visual space. The brightness of each pixel represented the response magnitude. White dashed circles marked the estimated expression area, ~450μm in diameter. (B) A coronal section of the injection site in V1. Overlaid bright-field image and red fluorescence signals. (C) Spike histograms of example SC cells in response to looming in the absence and presence of optogenetic stimulation. Blue dots in the top diagram marked their receptive field centers on the monitor. The dotted red circle marked a 15° radius circle around the monitor’s center. (D) Mean looming-evoked responses of SC cells that had receptive field centers inside the circle. Silencing cortex significantly reduced their visual responses (n=8, p<0.05 for 5°/s, p<0.01 for 160°/s, paired t-test). (E) Mean responses of SC cells with receptive field centers outside the circle. Silencing cortex had no effect on their visual responses (n=4, p>0.3 for all speeds, paired t-test). (F) Significant correlation between the transformation slope and receptive field distance from the monitor’s center (n=12 cells, 6 mice, correlation coefficient=0.62, p<0.05). Black line marked the linear regression of the data points. The transformation slope is the slope of the linear regression of mean responses between LED ON and OFF conditions for each cell. Pooled data were presented as mean±S.E.M.

Comment in

References

    1. Ayaz A, Saleem AB, Scholvinck ML, Carandini M. Locomotion controls spatial integration in mouse visual cortex. Curr Biol. 2013;23:890–894. - PMC - PubMed
    1. Brainard DH. The Psychophysics Toolbox. Spat Vis. 1997;10:433–436. - PubMed
    1. Cang J, Kaneko M, Yamada J, Woods G, Stryker MP, Feldheim DA. Ephrin-as guide the formation of functional maps in the visual cortex. Neuron. 2005;48:577–589. - PMC - PubMed
    1. Constantinople CM, Bruno RM. Deep cortical layers are activated directly by thalamus. Science. 2013;340:1591–1594. - PMC - PubMed
    1. Dean P, Redgrave P, Westby GW. Event or emergency? Two response systems in the mammalian superior colliculus. Trends Neurosci. 1989;12:137–147. - PubMed

Publication types

LinkOut - more resources