

Random forest-based protein model quality assessment (RFMQA) using structural features and potential energy terms
- PMID: 25222008
- PMCID: PMC4164442
- DOI: 10.1371/journal.pone.0106542
Random forest-based protein model quality assessment (RFMQA) using structural features and potential energy terms
Abstract
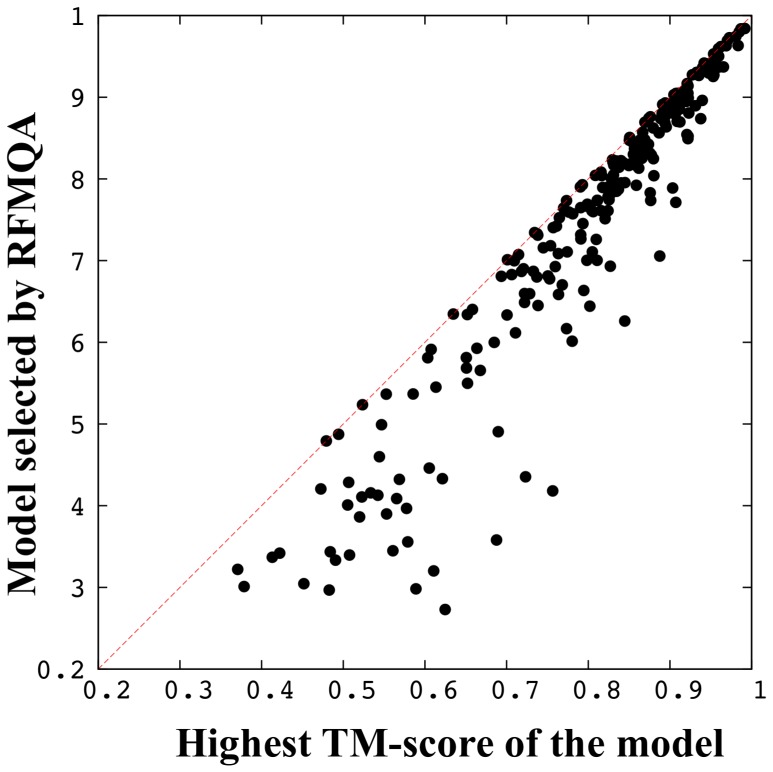
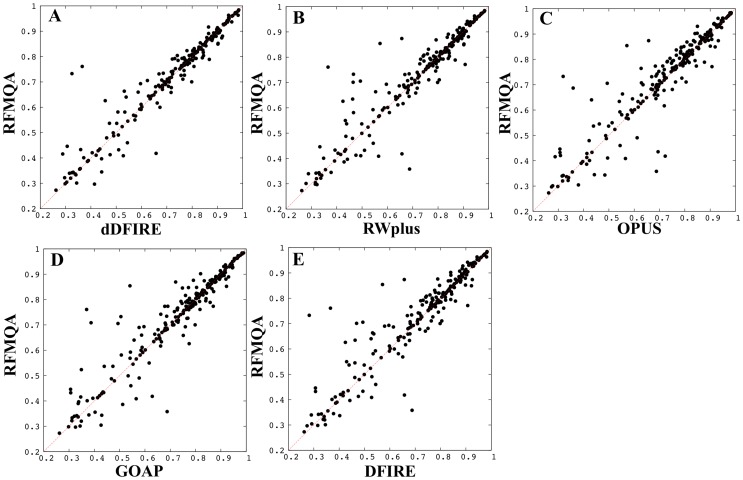
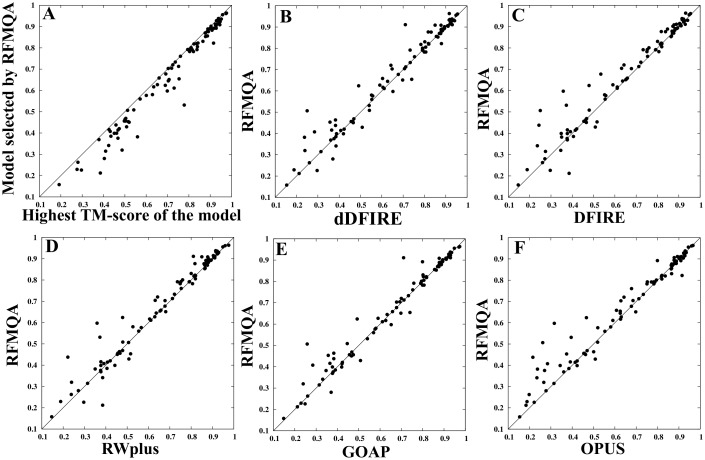
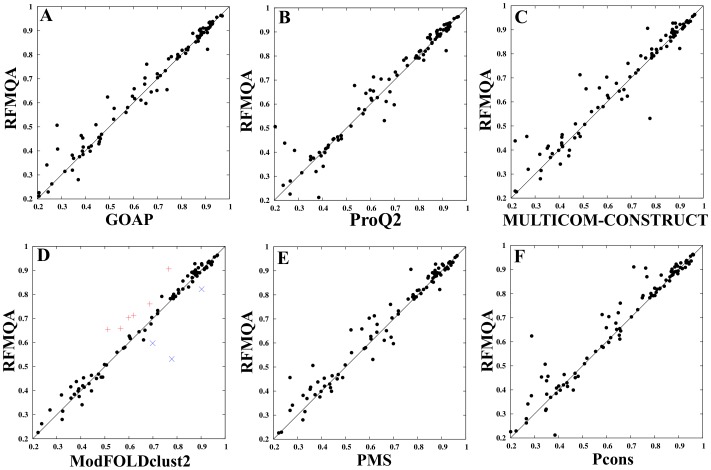
Recently, predicting proteins three-dimensional (3D) structure from its sequence information has made a significant progress due to the advances in computational techniques and the growth of experimental structures. However, selecting good models from a structural model pool is an important and challenging task in protein structure prediction. In this study, we present the first application of random forest based model quality assessment (RFMQA) to rank protein models using its structural features and knowledge-based potential energy terms. The method predicts a relative score of a model by using its secondary structure, solvent accessibility and knowledge-based potential energy terms. We trained and tested the RFMQA method on CASP8 and CASP9 targets using 5-fold cross-validation. The correlation coefficient between the TM-score of the model selected by RFMQA (TMRF) and the best server model (TMbest) is 0.945. We benchmarked our method on recent CASP10 targets by using CASP8 and 9 server models as a training set. The correlation coefficient and average difference between TMRF and TMbest over 95 CASP10 targets are 0.984 and 0.0385, respectively. The test results show that our method works better in selecting top models when compared with other top performing methods. RFMQA is available for download from http://lee.kias.re.kr/RFMQA/RFMQA_eval.tar.gz.
Conflict of interest statement
Figures
References
-
- Baker D, Sali A (2001) Protein structure prediction and structural genomics. Science 294: 93–96. - PubMed
-
- Lander ES, Linton LM, Birren B, Nusbaum C, Zody MC, et al. (2001) Initial sequencing and analysis of the human genome. Nature 409: 860–921. - PubMed
-
- Kihara D, Chen H, Yang YD (2009) Quality assessment of protein structure models. Curr Protein Pept Sci 10: 216–228. - PubMed
-
- Kryshtafovych A, Venclovas C, Fidelis K, Moult J (2005) Progress over the first decade of CASP experiments. Proteins 61 Suppl 7225–236. - PubMed
-
- Moult J (2005) A decade of CASP: progress, bottlenecks and prognosis in protein structure prediction. Curr Opin Struct Biol 15: 285–289. - PubMed
Publication types
MeSH terms
Substances
LinkOut - more resources
Full Text Sources
Other Literature Sources
Miscellaneous
