. 2014 Sep 15;9(9):e107378.
doi: 10.1371/journal.pone.0107378. eCollection 2014.

Retrocrural space involvement on computed tomography as a predictor of mortality and disease severity in acute pancreatitis

Affiliations

Retrocrural space involvement on computed tomography as a predictor of mortality and disease severity in acute pancreatitis

Haotong Xu et al. PLoS One. .

Abstract

Background: Because computed tomography (CT) has advantages for visualizing the manifestation of necrosis and local complications, a series of scoring systems based on CT manifestations have been developed for assessing the clinical outcomes of acute pancreatitis (AP), including the CT severity index (CTSI), modified CTSI, etc. Despite the internationally accepted CTSI having been successfully used to predict the overall mortality and disease severity of AP, recent literature has revealed the limitations of the CTSI. Using the Delphi method, we establish a new scoring system based on retrocrural space involvement (RCSI), and compared its effectiveness at evaluating the mortality and severity of AP with that of the CTSI.

Methods: We reviewed CT images of 257 patients with AP taken within 3-5 days of admission in 2012. The RCSI scoring system, which includes assessment of infectious conditions involving the retrocrural space and the adjacent pleural cavity, was established using the Delphi method. Two radiologists independently assessed the RCSI and CTSI scores. The predictive points of the RCSI and CTSI scoring systems in evaluating the mortality and severity of AP were estimated using receiver operating characteristic (ROC) curves.

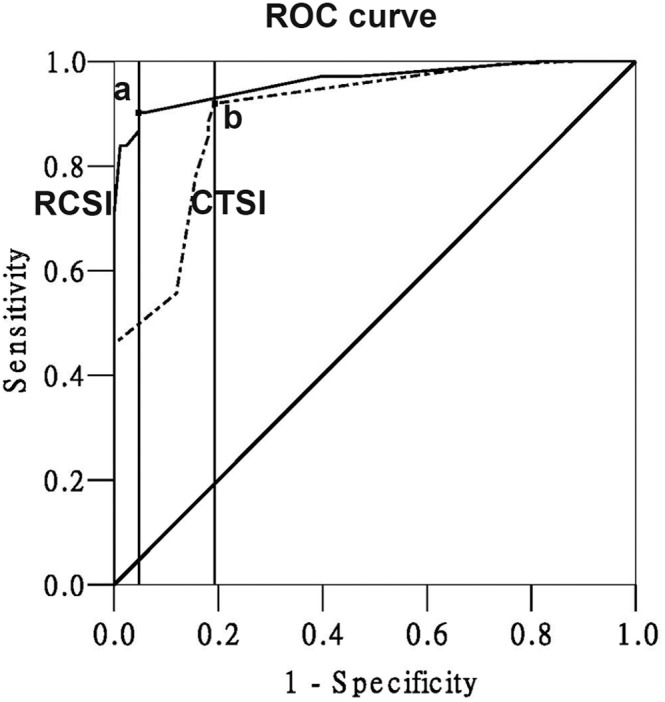
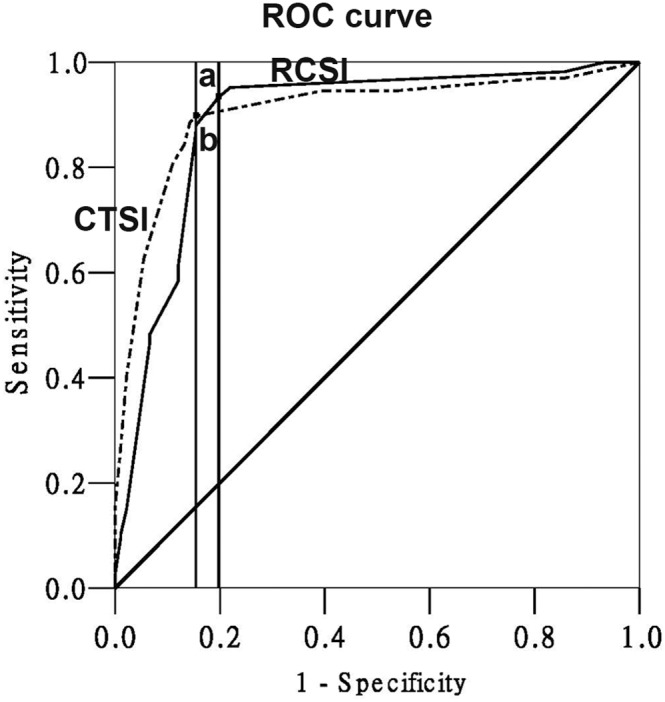
Principal findings: The RCSI score can accurately predict the mortality and disease severity. The area under the ROC curve for the RCSI versus CTSI score was 0.962±0.011 versus 0.900±0.021 for predicting the mortality, and 0.888±0.025 versus 0.904±0.020 for predicting the severity of AP. Applying ROC analysis to our data showed that a RCSI score of 4 was the best cutoff value, above which mortality could be identified.

Conclusion: The Delphi method was innovatively adopted to establish a scoring system to predict the clinical outcome of AP. The RCSI scoring system can predict the mortality of AP better than the CTSI system, and the severity of AP equally as well.


Conflict of interest statement

Competing Interests: Co-author Shao-Xiang Zhang is a PLOS ONE Editorial Board member; this does not alter the authors' adherence to PLOS ONE Editorial policies and criteria.

Figures

Figure 1
Figure 1. Visualization of the anatomic location of retrocrural space across diaphragmatic hiatuses section on CVH2.
(A) On the upper section, the anterior margin of the retrocrural space (C) consists of the distal esophagus (D), the posterior border is thoracolumbar vertebra, both anterolateral borders are composed of the diaphragmatic crus (A), both posterolateral borders are made up of the mediastinal pleura (B). The aorta (E) is situated in the retrocrural space. The potential recess located between the diaphragmatic crura and the mediastinal pleura is the interior costophrenic sulcus (G). The peripancreatic fluid may drain into the retrocrural space via the esophageal hiatus (F). (B) On the lower section, the anterior border of the retrocrural space is open to the retroperotoneum, the posterior border is the lumbar vertebra, both lateral borders are made up of the diaphragmatic crus (A), the mediastinal pleura (B) constitutes the right posterolateral border. The inferior vena cava (K) and the both sides of adrenal glands (I) are distributed at the anterolateral direction of the retrocrural space. Furthermore, the peripancreatic fluid that originates from the pancreas (J) may drain into the retrocrural space across the aortic hiatus (H).
Figure 2
Figure 2. CT manifestations of the retrocrural space involvement in a 48-year-old man with AP.
(A, B) CT scans obtained 3 days after admission showed acute fluid collections at the left subphrenic spaces. They resulted in the hydropsia of the left diaphragm (long white arrow), and the thickening of the left mediastinal pleura (short white arrow). In addition, a streaky density occurred at the left retrocrural space (arrowhead). On the opposite side, the right crus has a rough edge (black arrow). (C) CT scans displayed the peripancreatic fluid collections had extended into the left retroperitoneal space.
Figure 3
Figure 3. CT scans showing peripancreatic fluid draining into retrocrural space in a 46-year-old woman with AP.
(A) On the upper section, CT scans obtained 4 days after admission showed the peripancreatic fluid had drained into the retrocrural space across the esophageal hiatus (short white arrow); then formed a fistulous tract into pleural cavity and developed into the pleural effusion (long black arrow). (B) On the middle section, pancreatic head necrosis is shown as a non-enhanced area that was less than 30% of total pancreatic area (black arrowhead). The bilateral diaphragmatic crus were shown hydropsia (long white arrow). (C) On the lower section, CT scans show the fluid had extended into the right retroperitoneal space (short black arrow) and further drained into the retrocrural space across the aortic hiatus (white arrowhead).
Figure 4
Figure 4. ROC curves of the RCSI score and CTSI score in predicting the mortality.
(a: cutoff value = 4.0, sensitivity = 82.11%, specificity = 96.91%; b: cutoff value = 2.0, sensitivity = 77.27%, specificity = 91.12%).
Figure 5
Figure 5. ROC curves of the RCSI and CTSI score in distinguishing between mild and severe AP.
(a: cutoff value = 3.0, sensitivity = 79.38%, specificity = 87.50%; b: cutoff value = 4.0, sensitivity = 81.91%, specificity = 91.41%).

References

    1. Balthazar EJ (2002) Complications of acute pancreatitis: clinical and CT evaluation. Radiol Clin North Am 40: 1211–1227. - PubMed
    1. Lenhart DK, Balthazar EJ (2008) MDCT of acute mild (nonnecrotizing) pancreatitis: abdominal complications and fate of fluid collections. American Journal of Roentgenology 190: 643–649. - PubMed
    1. Balthazar EJ, Freeny PC, vanSonnenberg E (1994) Imaging and intervention in acute pancreatitis. Radiology 193: 297–306. - PubMed
    1. Mortele KJ, Wiesner W, Intriere L, Shankar S, Zou KH, et al. (2004) A modified CT severity index for evaluating acute pancreatitis: improved correlation with patient outcome. AJR Am J Roentgenol 183: 1261–1265. - PubMed
    1. De Waele JJ, Delrue L, Hoste EA, De Vos M, Duyck P, et al. (2007) Extrapancreatic inflammation on abdominal computed tomography as an early predictor of disease severity in acute pancreatitis: evaluation of a new scoring system. Pancreas 34: 185–190. - PubMed

Publication types