. 2014 Nov;4(11):1342-53.
doi: 10.1158/2159-8290.CD-14-0622. Epub 2014 Sep 15.

Genomic landscape of Ewing sarcoma defines an aggressive subtype with co-association of STAG2 and TP53 mutations

Affiliations

Genomic landscape of Ewing sarcoma defines an aggressive subtype with co-association of STAG2 and TP53 mutations

Franck Tirode et al. Cancer Discov. 2014 Nov.

Abstract

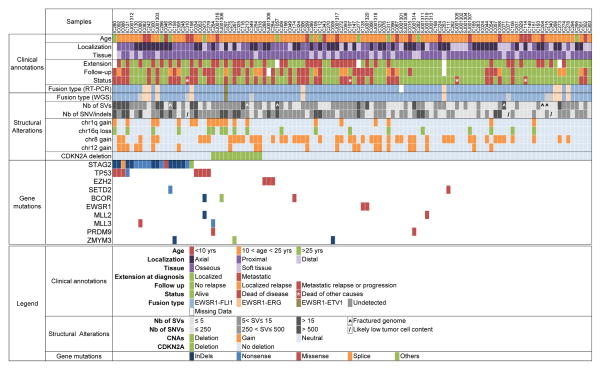
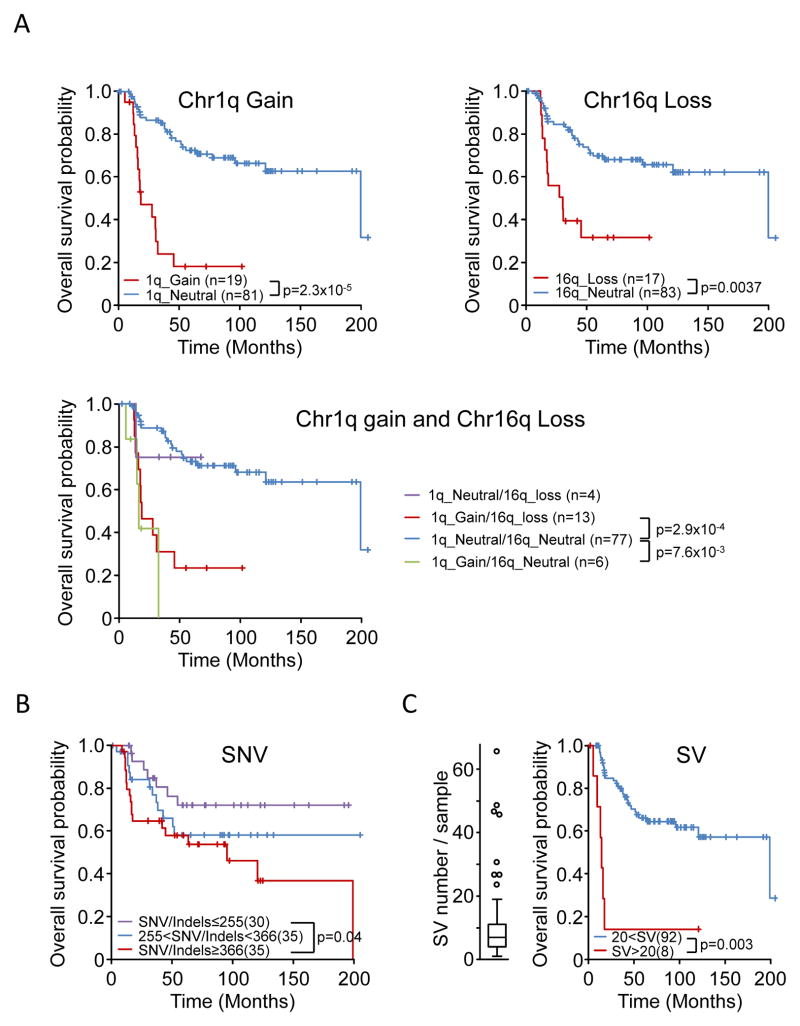
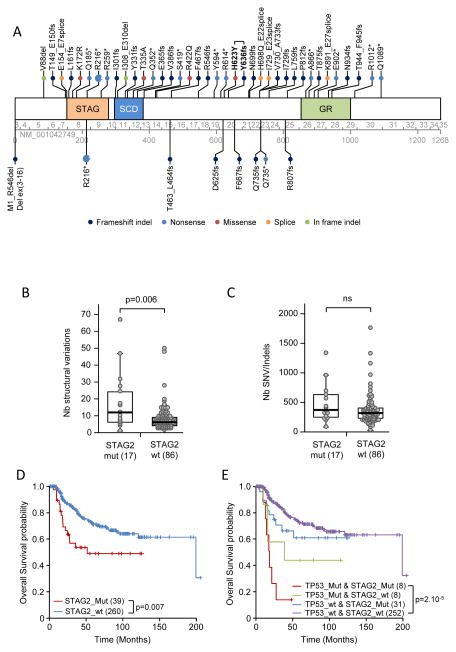
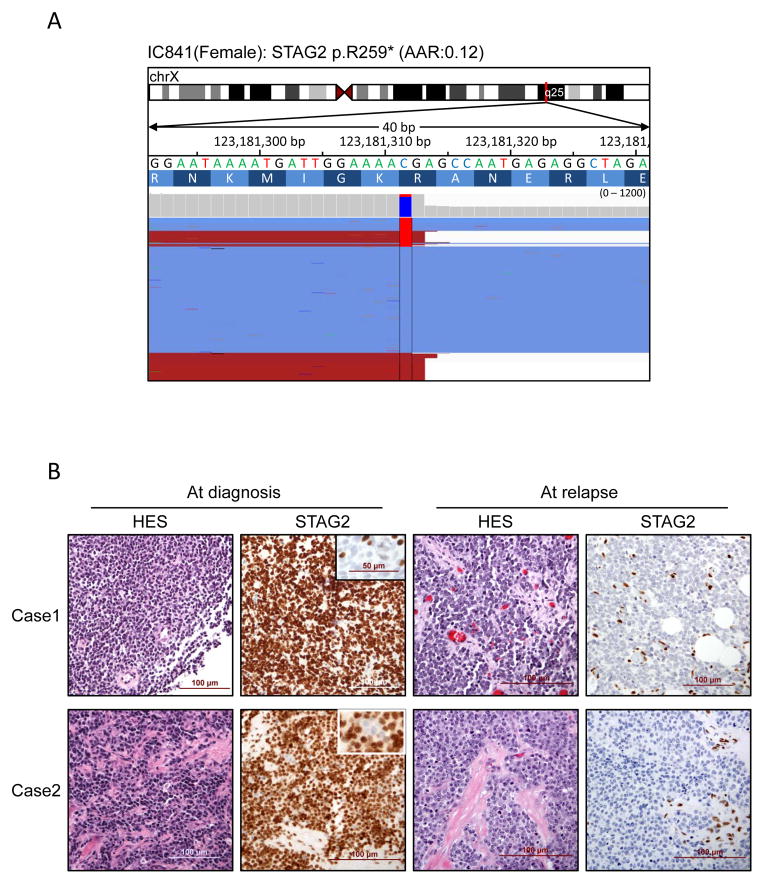
Ewing sarcoma is a primary bone tumor initiated by EWSR1-ETS gene fusions. To identify secondary genetic lesions that contribute to tumor progression, we performed whole-genome sequencing of 112 Ewing sarcoma samples and matched germline DNA. Overall, Ewing sarcoma tumors had relatively few single-nucleotide variants, indels, structural variants, and copy-number alterations. Apart from whole chromosome arm copy-number changes, the most common somatic mutations were detected in STAG2 (17%), CDKN2A (12%), TP53 (7%), EZH2, BCOR, and ZMYM3 (2.7% each). Strikingly, STAG2 mutations and CDKN2A deletions were mutually exclusive, as confirmed in Ewing sarcoma cell lines. In an expanded cohort of 299 patients with clinical data, we discovered that STAG2 and TP53 mutations are often concurrent and are associated with poor outcome. Finally, we detected subclonal STAG2 mutations in diagnostic tumors and expansion of STAG2-immunonegative cells in relapsed tumors as compared with matched diagnostic samples.

Significance: Whole-genome sequencing reveals that the somatic mutation rate in Ewing sarcoma is low. Tumors that harbor STAG2 and TP53 mutations have a particularly dismal prognosis with current treatments and require alternative therapies. Novel drugs that target epigenetic regulators may constitute viable therapeutic strategies in a subset of patients with mutations in chromatin modifiers.


Conflict of interest statement

Conflict of interest: The authors disclose no potential conflicts of interest

Figures

Figure 1
Figure 1. A comprehensive profile of the genetic abnormalities in Ewing sarcoma and associated clinical information
Key clinical characteristics are indicated, including primary site, type of tissue, and metastatic status at diagnosis, follow-up, and last news. Below is the consistency of detection of gene fusions by RT-PCR and WGS. The numbers of structural variants and single-nucleotide variants as well as indels are reported in a greyscale. The presence of the main copy-number changes, chr 1q gain, chr 16 loss, chr 8 gain, chr 12 gain and interstitial CDKN2A deletion is indicated. Last are listed the most significant mutations and their types. See Supplementary Table S2 for the complete lists of SNVs/indels, SVs, and CNAs. For gene mutations, others refer to: duplication of exon 22 leading to frameshift (STAG2), deletion of exon 2 to 11 (BCOR) and deletion of exons 1 to 6 (ZMYM3).
Figure 2
Figure 2. Prognostic significance of CNAs, SVs, and SNV/indels
Kaplan-Meier overall survival estimates according to A) Chromosome 1q gain, chromosome 16q loss; chromosome 1q gain and 16qloss; B) number of SNV/indels. Samples were stratified according to the number of genomic SNVs/indels and split into tertiles; C) a large number of SVs. The overall survival of patients whose tumors harbor an outlier number of SVs (boxplot distribution shown on the left) is compared to that of other patients. Patients with a fractured genome, low tumor purity, or death of causes other than Ewing sarcoma were excluded from the analysis.
Figure 3
Figure 3. STAG2 mutations and their prognostic significance in Ewing sarcomas
A) Schematic of the STAG2 protein and mutations. Mutations found in tumor samples are indicated above the protein, and those observed in cell lines are indicated below. Mutation nomenclature is based on the NM_001042749 reference sequence. Exon and amino-acid numbering is indicated below the protein. The recurrent R216* mutation was observed in 7 cases. One tumor (case IC871) had two mutations (indicated in bold). SCD: stromalin conservative domain; GR: glutamine-rich region. Box plots show comparison of the number of SVs (B) and SNVs/indels (C) in wild-type and STAG2-mutated tumor samples. Samples with a fractured genome or low tumor cell content (see Fig. 1) were excluded from analysis, leaving 17 STAG2-mutated cases and 86 wild-type cases. Box represents the central 50% of data points (interquartile range). Upper and lower whiskers represent the largest and smallest observed values within 1.5 times the interquartile range from the ends of the box. Circles represent individual values. P-values were determined by using the Mann-Whitney test. D) Overall survival among 299 patients according to STAG2 mutation status. The number of patients in the different groups is indicated in brackets. E) Overall survival of the 299 patients according to their STAG2 and/or TP53 mutation status.
Figure 4
Figure 4. Subclonal presence of STAG2 mutations
A) Integrative Genomics Viewer representation showing the subclonal presence of STAG2 mutations in one sample. B) Evolution of STAG2 staining between diagnosis and relapse in two independent cases. Whereas only a small subset of tumor cells lacked STAG2 expression at diagnosis (see insets), the tumor cells were homogeneously negative at relapse. The few STAG2-positive stromal cells serve as an internal positive control.

References

    1. Lessnick SL, Ladanyi M. Molecular pathogenesis of Ewing sarcoma: new therapeutic and transcriptional targets. Annu Rev Pathol. 2012;7:145–59. - PMC - PubMed
    1. Delattre O, Zucman J, Plougastel B, Desmaze C, Melot T, Peter M, et al. Gene fusion with an ETS DNA-binding domain caused by chromosome translocation in human tumours. Nature. 1992;359:162–5. - PubMed
    1. May WA, Lessnick SL, Braun BS, Klemsz M, Lewis BC, Lunsford LB, et al. The Ewing’s sarcoma EWS/FLI-1 fusion gene encodes a more potent transcriptional activator and is a more powerful transforming gene than FLI-1. Mol Cell Biol. 1993;13:7393–8. - PMC - PubMed
    1. Armengol G, Tarkkanen M, Virolainen M, Forus A, Valle J, Bohling T, et al. Recurrent gains of 1q, 8 and 12 in the Ewing family of tumours by comparative genomic hybridization. Br J Cancer. 1997;75:1403–9. - PMC - PubMed
    1. Brisset S, Schleiermacher G, Peter M, Mairal A, Oberlin O, Delattre O, et al. CGH analysis of secondary genetic changes in Ewing tumors: correlation with metastatic disease in a series of 43 cases. Cancer Genet Cytogenet. 2001;130:57–61. - PubMed

Publication types