. 2014 Oct;42(18):11668-86.
doi: 10.1093/nar/gku812. Epub 2014 Sep 15.

Monomeric nature of dengue virus NS3 helicase and thermodynamic analysis of the interaction with single-stranded RNA

Affiliations

Monomeric nature of dengue virus NS3 helicase and thermodynamic analysis of the interaction with single-stranded RNA

Leopoldo G Gebhard et al. Nucleic Acids Res. 2014 Oct.

Abstract

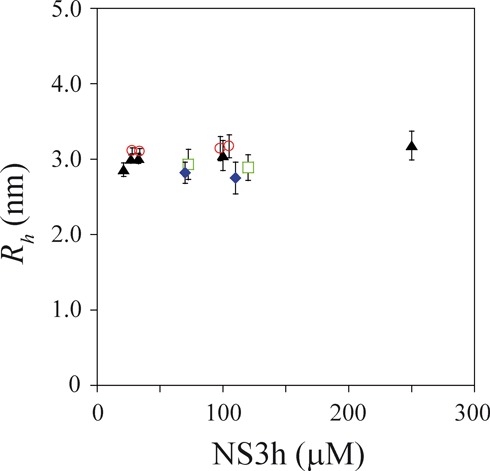
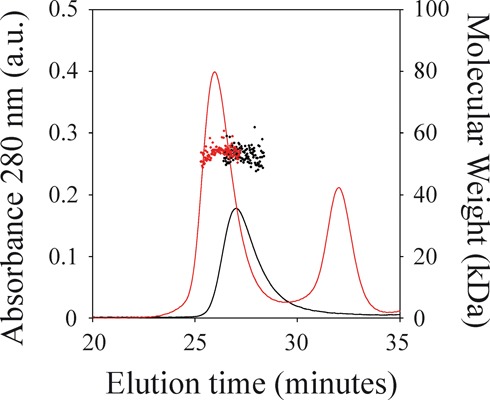
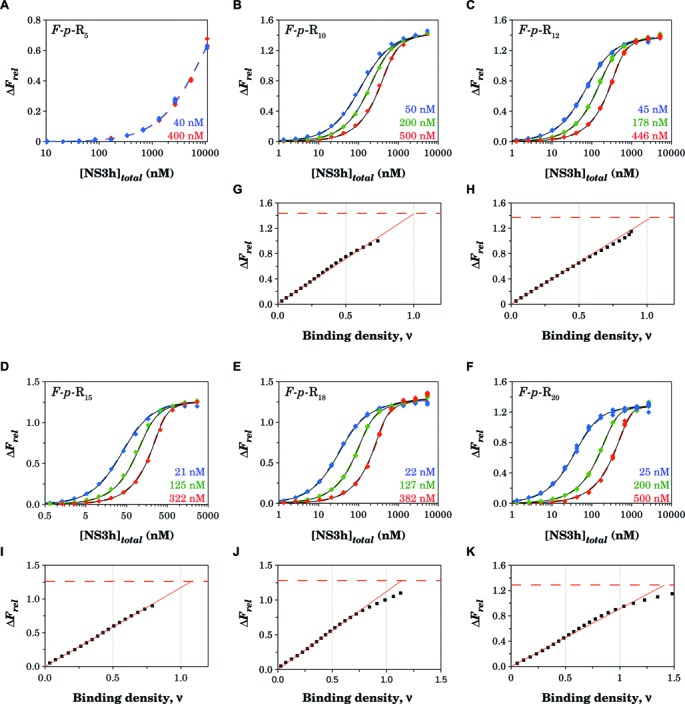
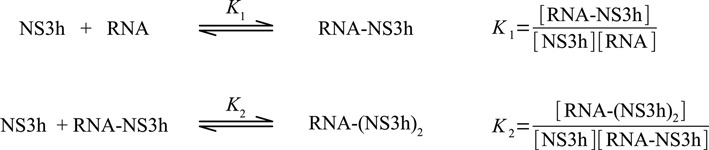
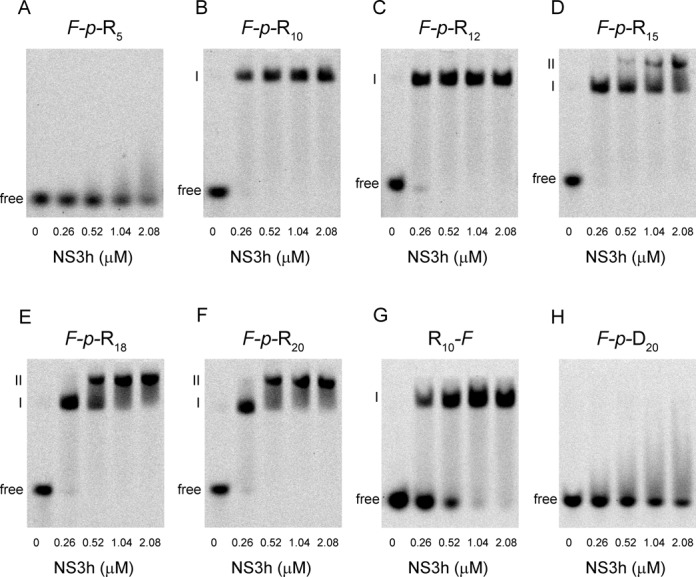
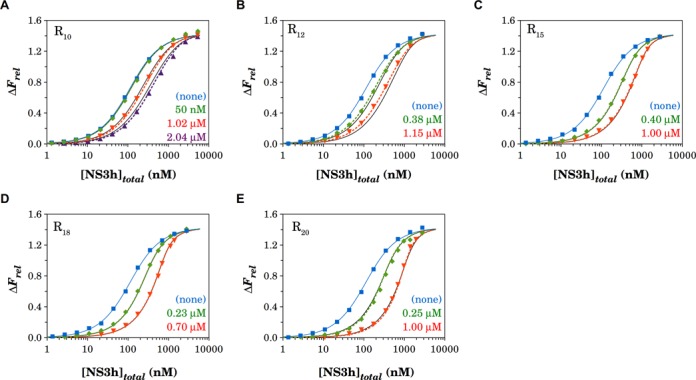
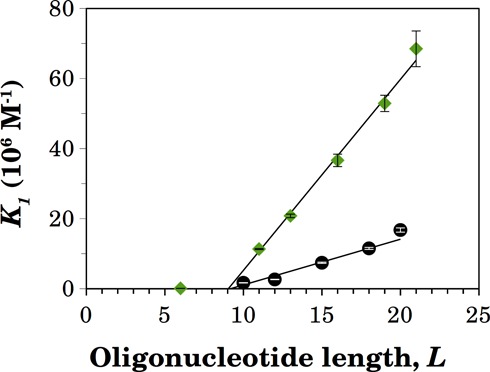
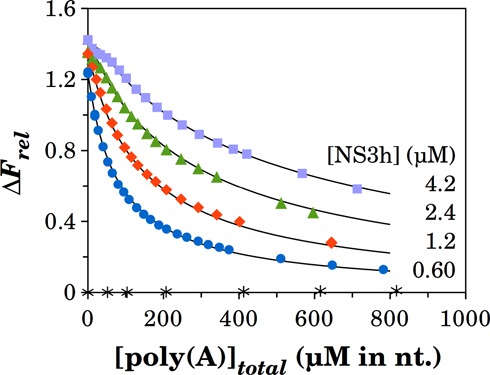
Dengue virus nonstructural protein 3 (NS3) is a multifunctional protein formed by a superfamily-2 RNA helicase linked to a protease domain. In this work, we report results from in vitro experiments designed to determine the oligomeric state of dengue virus NS3 helicase (NS3h) and to characterize fundamental properties of the interaction with single-stranded (ss)RNA. Pulsed field gradient-NMR spectroscopy was used to determine the effective hydrodynamic radius of NS3h, which was constant over a wide range of protein concentrations in the absence and presence of ssRNA. Size exclusion chromatography-static light scattering experiments showed that NS3h eluted as a monomeric molecule even in the presence of ssRNA. Binding of NS3h to ssRNA was studied by quantitative fluorescence titrations using fluorescein-labeled and unlabeled ssRNA oligonucleotides of different lengths, and the effect of the fluorescein label on the interaction parameters was also analyzed. Experimental results were well described by a statistical thermodynamic model based on the theory of non-specific interactions of large ligands to a one-dimensional lattice. We found that binding of NS3h to ssRNA oligonucleotides and to poly(A) is characterized by minimum and occluded binding site sizes both of 10 nucleotides and by a weak positive cooperativity between adjacent proteins.


Figures

Figure 1.
Figure 1.
Effective hydrodynamic radius of NS3h. PFG-NMR experiments were performed in four experimental conditions: NS3h alone (triangles), NS3h + R10 (circles), NS3h + AMP-PNP (diamonds) and NS3h + R10 + AMP-PNP (squares). Experiments were performed in media containing 10-mM Tris-HCl (pH 7.0), 100-mM KCl, 1.0-mM DTT, 2.0-mM MgCl2 and 10% D2O at 27°C. Vertical bars represent the 95% confidence intervals of Rh values computed through propagation from the standard errors of the estimated values of ddiox and dNS3h (Equation (2)). Mean Rh values (± standard error) are 3.0 (± 0.1) nm for NS3h alone, 3.1 (± 0.1) nm for NS3h + R10, 2.8 (± 0.3) nm for NS3h + AMP-PNP and 2.9 (± 0.2) nm for NS3h + R10 + AMP-PNP.
Figure 2.
Figure 2.
Molecular weight determinations of NS3h by static light scattering. Size-exclusion chromatography elution profiles of NS3h alone (black solid line) and of a 1:2 mixture of NS3h and the R10 oligonucleotide (red solid line) as monitored by the absorbance at 280 nm are shown (left axis). Molecular weights computed from 90° light scattering (right axis) are shown for the peak corresponding to elution of NS3h (black dots) and of the NS3h–RNA complex (red dots). Mean values (± standard error) of the corresponding molecular weights are 53 (± 2) kDa for NS3h alone, and 55 (± 2) kDa for the NS3h–RNA complex.
Figure 3.
Figure 3.
Fluorescence titrations of 5′-fluorescein-labeled oligonucleotides of different lengths with NS3h. Binding of NS3h to the oligonucleotides was monitored by the relative fluorescence increase upon excitation at 495 nm. (A–F) Titrations were performed in buffer B at 30°C at the indicated concentrations of the F-p-R oligonucleotides (see Table 1). Colored dashed lines are simulations based on Equation (11) (A–D) or Equation (12) (E and F) with parameter values shown in Table 2, which in turn were obtained from simultaneous nonlinear least-squares analysis of the data from each set of titration curves. Black solid lines are simulations of the statistical thermodynamic model with parameter values shown in Table 5 and Supplementary Table S2. (G–K) Dependence of the relative fluorescence increase on the binding density (ν) was obtained as explained in the Materials and Methods section. Solid straight lines are linear least-square fits that follow the initial linear phase of the plots and have no theoretical basis. Horizontal dashed lines indicate the value of the maximum fluorescence increase ΔFmax obtained from the titration curves.
Scheme 1.
Scheme 1.
Reaction scheme for the binding of NS3h to ssRNA oligonucleotides.
Figure 4.
Figure 4.
Electrophoretic mobility shift assays of fluorescein-labeled oligonucleotides with NS3h. The indicated fluorescein-labeled oligonucleotides at 0.25 μM were incubated with NS3h at the indicated concentrations. Free oligonucleotides migrate rapidly to the bottom of the gels, while oligonucleotides bound to NS3h are retarded. A laser scanner was used to visualize the fluorescent samples in the gels.
Figure 5.
Figure 5.
Competition titrations of unlabeled R oligonucleotides of different lengths with NS3h. Mixtures of F-p-R10 at 50 nM and each R oligonucleotide at the indicated concentrations were titrated with NS3h. Binding of NS3h to the F-p-R10 oligonucleotide was monitored by the relative fluorescence enhancement upon excitation at 495 nm. Titrations were performed in buffer B at 30°C. Colored lines are simulations of the model defined by Equations (11), (13) and (14) with values of parameters given in Table 2 for the binding of NS3h to the F-p-R10 oligonucleotide and with best-fitting parameter value given in Table 3 for the binding of NS3h to the R oligonucleotides. Black solid lines are simulations of the statistical thermodynamic model with parameter values shown in Table 5..
Figure 6.
Figure 6.
Length dependence of the macroscopic association constant K1 for the binding of NS3h to a naked oligonucleotide. Values of K1 were obtained from the analysis of the titration curves of the F-p-R oligonucleotides shown in Figure 3 (diamonds) and of the competition titrations of the R oligonucleotides shown in Figure 5 (circles). Error bars represent the standard error of estimated values of K1 provided by nonlinear regression analysis. The continuous lines are the plots of Equation (15) with best-fitting parameter values of n = (10.0 ± 0.2) nucleotides and Kint = (5.6 ± 0.2) 106 M−1 for F-p-R oligonucleotides and of n = (10.2 ± 0.6) nucleotides and Kint = (1.3 ± 0.2) 106 M−1 for unlabeled R oligonucleotides.
Figure 7.
Figure 7.
Competition of poly(A) and the F-p-R10 oligonucleotide for binding to NS3h. Mixtures of F-p-R10 at 51 nM and NS3h at the indicated concentrations were titrated with poly(A). Solid lines are simulations of the model defined by Equation (11) with values of K1 and ΔFmax for the F-p-R10 RNA as given in Table 2, and Equations (16–19) with best-fitting parameter values of KpA = (9.0 ± 0.1) 104 M−1, ωpA = 14 ± 1 and m = (10.9 ± 0.8) nucleotides. ΔFrel values of mixtures of F-p-R10 at 51 nM with poly(A) in the absence of NS3h (blank titration) are shown with asterisk labels.

References

    1. Gubler D.J. Epidemic dengue/dengue hemorrhagic fever as a public health, social and economic problem in the 21st century. Trends Microbiol. 2002;10:100–103. - PubMed
    1. Bhatt S., Gething P.W., Brady O.J., Messina J.P., Farlow A.W., Moyes C.L., Drake J.M., Brownstein J.S., Hoen A.G., Sankoh O., et al. The global distribution and burden of dengue. Nature. 2013;496:504–507. - PMC - PubMed
    1. World Health Organization. Dengue: Guidelines for Diagnosis, Treatment, Prevention, and Control. World Health Organization, Geneva, Switzerland: 2009. - PubMed
    1. Weaver S.C., Vasilakis N. Molecular evolution of dengue viruses: contributions of phylogenetics to understanding the history and epidemiology of the preeminent arboviral disease. Infect. Genet. Evol. 2009;9:523–540. - PMC - PubMed
    1. Chambers T.J., Hahn C.S., Galler R., Rice C.M. Flavivirus genome organization, expression, and replication. Annu. Rev. Microbiol. 1990;44:649–688. - PubMed

Publication types