. 2014 Dec;58(12):7151-63.
doi: 10.1128/AAC.03104-14. Epub 2014 Sep 15.

Impact of antibiotics with various target sites on the metabolome of Staphylococcus aureus

Affiliations

Impact of antibiotics with various target sites on the metabolome of Staphylococcus aureus

Kirsten Dörries et al. Antimicrob Agents Chemother. 2014 Dec.

Abstract

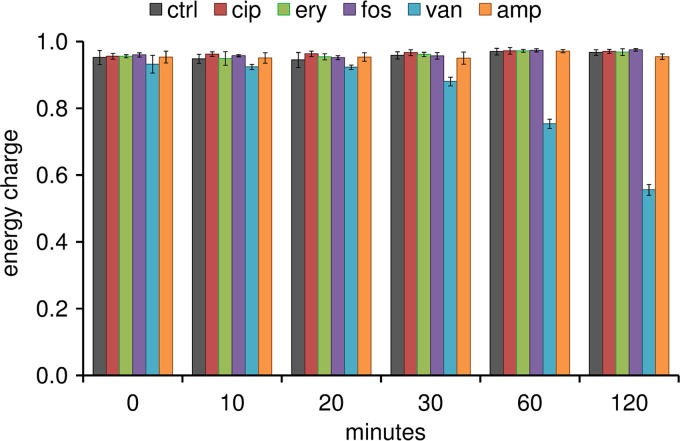
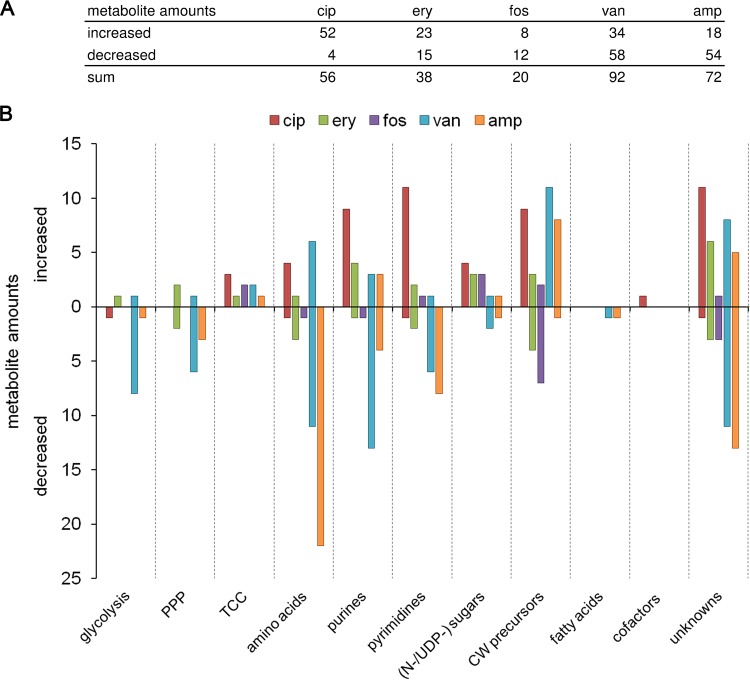
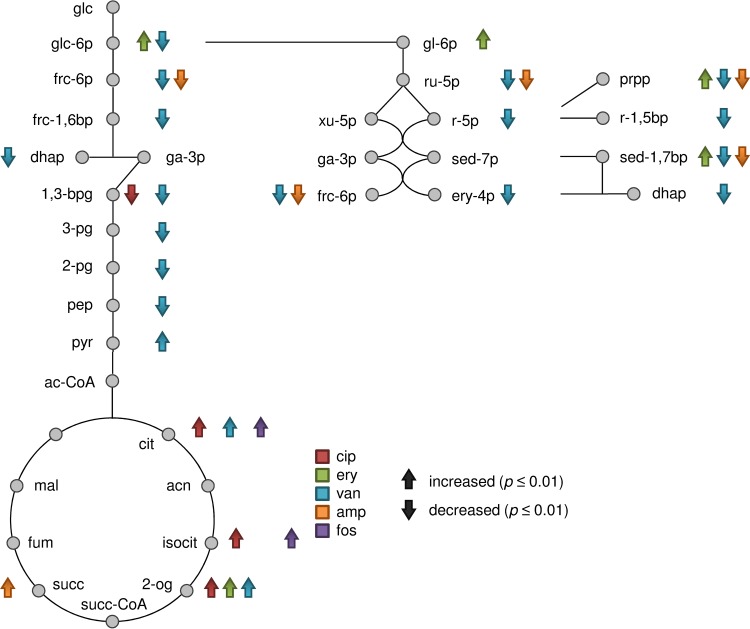
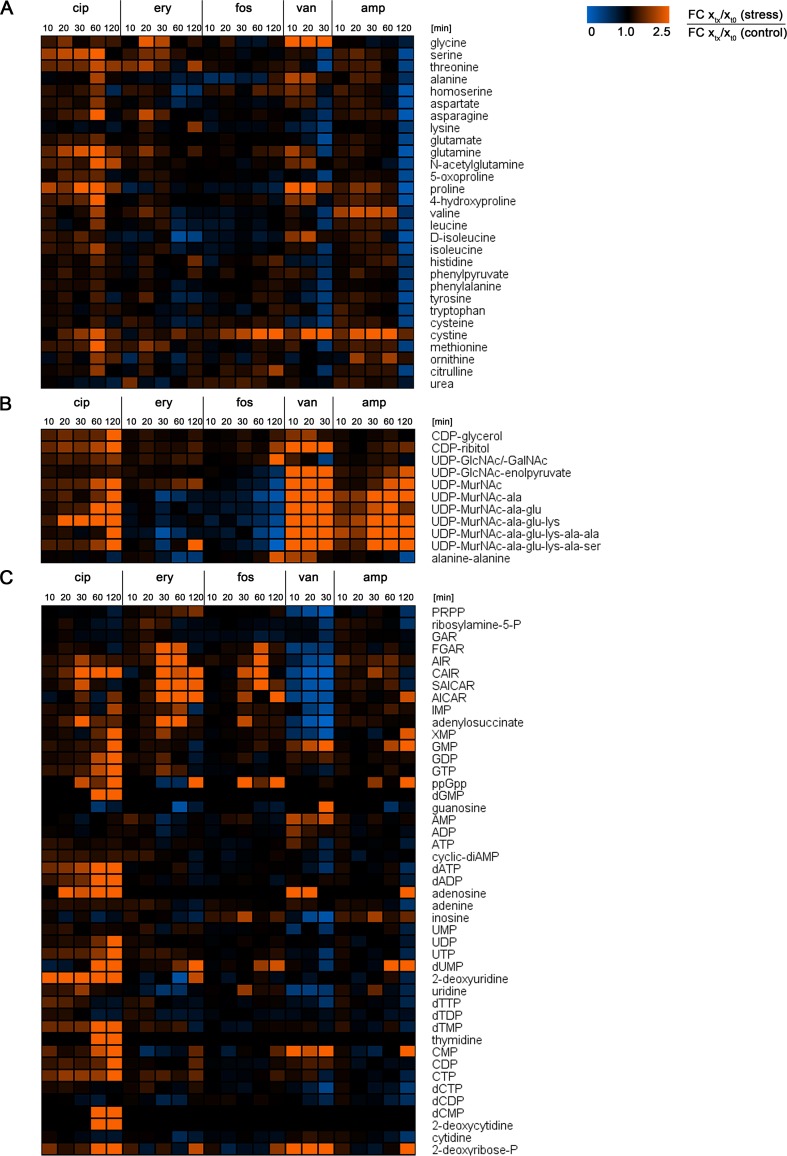
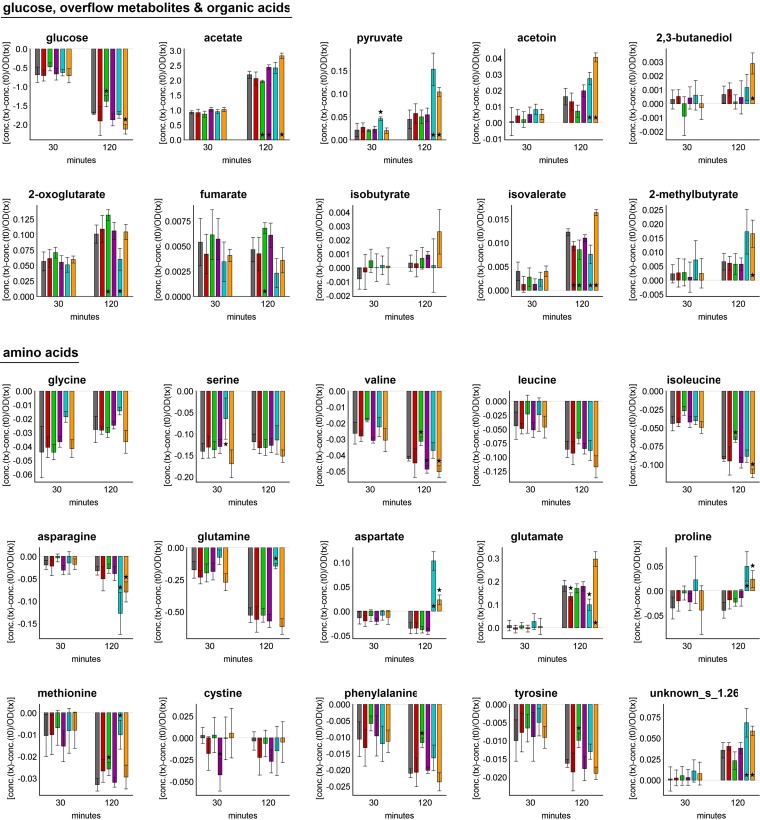
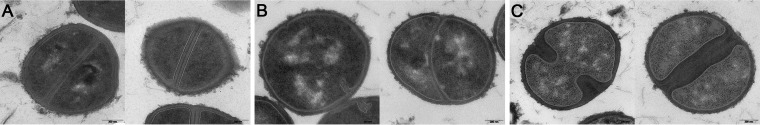
In this study, global intra- and extracellular metabolic profiles were exploited to investigate the impact of antibiotic compounds with different cellular targets on the metabolome of Staphylococcus aureus HG001. Primary metabolism was largely covered, yet uncommon staphylococcal metabolites were detected in the cytosol of S. aureus, including sedoheptulose-1,7-bisphosphate and the UDP-MurNAc-pentapeptide with an alanine-seryl residue. By comparing the metabolic profiles of unstressed and stressed staphylococcal cells in a time-dependent manner, we found far-ranging effects within the metabolome. For each antibiotic compound, accumulation as well as depletion of metabolites was detected, often comprising whole biosynthetic pathways, such as central carbon and amino acid metabolism and peptidoglycan, purine, and pyrimidine synthesis. Ciprofloxacin altered the pool of (deoxy)nucleotides as well as peptidoglycan precursors, thus linking stalled DNA and cell wall synthesis. Erythromycin tended to increase the amounts of intermediates of the pentose phosphate pathway and lysine. Fosfomycin inhibited the first enzymatic step of peptidoglycan synthesis, which was followed by decreased levels of peptidoglycan precursors but enhanced levels of substrates such as UDP-GlcNAc and alanine-alanine. In contrast, vancomycin and ampicillin inhibited the last stage of peptidoglycan construction on the outer cell surface. As a result, the amounts of UDP-MurNAc-peptides drastically increased, resulting in morphological alterations in the septal region and in an overall decrease in central metabolite levels. Moreover, each antibiotic affected intracellular levels of tricarboxylic acid cycle intermediates.


Figures

FIG 1
FIG 1
Adenylate energy charges of untreated cells (black) and cells exposed to ciprofloxacin (cip; red), erythromycin (ery; green), fosfomycin (fos; purple), vancomycin (van; blue), and ampicillin (amp; orange). The AEC was calculated using the intracellular amounts of ATP, ADP, and AMP (nmol/mg cell dry weight). Data are shown as mean values ± standard deviations (SD) for quintuplicate samples.
FIG 2
FIG 2
(A) Table showing numbers of intracellular metabolites with significantly (P ≤ 0.01) enhanced and decreased fold changes (FC stress compared to FC control) within 120 min of antibiotic treatment and within 30 min of vancomycin treatment. Data are based on mean values for quintuplicate samples. (B) Bar chart displaying significantly altered metabolite numbers from panel A sorted by the respective metabolic pathways. Columns are colored according to the antibiotic stress: red, ciprofloxacin; green, erythromycin; purple, fosfomycin; blue, vancomycin; and orange, ampicillin. PPP, pentose phosphate pathway; TCC, tricarboxylic acid cycle, (N-/UDP-) sugars, amino sugars/UDP-activated sugars; CW, cell wall.
FIG 3
FIG 3
Central carbon metabolism, including glycolysis, the pentose phosphate pathway, and the tricarboxylic acid cycle. Significantly enhanced or decreased FC of intracellular metabolite amounts are marked with up or down arrows (P ≤ 0.01). Alterations within 120 min after antibiotic treatment with ciprofloxacin, erythromycin, fosfomycin, and ampicillin and within 30 min of vancomycin treatment were taken into account. Data are based on mean values for quintuplicate samples. The arrows are colored according to the antibiotic stress: red, ciprofloxacin; green, erythromycin; blue, vancomycin; orange, ampicillin; and purple, fosfomycin. Metabolite abbreviations: glc, glucose; frc, fructose; sed, sedoheptulose; ery, erythrose; pg, phosphoglycerate; dhap, dihydroxyacetone phosphate; ga-3p, glyceraldehyde 3-phosphate; 1,3-bpg, 1,3-bisphosphoglycerate; pep, phosphoenolpyruvate; pyr, pyruvate; ac-CoA, acetyl-coenzyme A; cit, citrate; acn, aconitate; isocit, isocitrate; 2-og, 2-oxoglutarate; succ-CoA, succinyl-coenzyme A; succ, succinate; fum, fumarate; mal, malate; gl-6p, 6-phosphogluconate; ru-5p, ribulose 5-phosphate; r-5p, ribose 5-phosphate; xu-5p, xylulose 5-phosphate; prpp, phosphoribosylpyrophosphate; r-1,5bp, ribose 1,5-bisphosphate.
FIG 4
FIG 4
Color-coded heat maps displaying FC of intracellular metabolite amounts in antibiotic-stressed S. aureus cells relative to the FC of metabolite amounts of control cells, calculated for every sampling point after exposure to the antibiotic stress. For vancomycin-stressed cells, only metabolite changes within 30 min after treatment are displayed. Lowered metabolite levels in stressed cells compared to control cells are indicated by blue areas. Raised metabolite levels in stressed cells compared to control cells are indicated by orange areas. Similar metabolite levels in stressed and control cells are indicated in black, indicating an FC of 1. Data are shown as mean values for quintuplicate samples. (A) FC of amino acids; (B) FC of cell wall precursors; (C) FC of intermediates of purine and pyrimidine metabolism. Names of metabolites are written out in full in Table S7 in the supplemental material.
FIG 5
FIG 5
Uptake and accumulation of selected extracellular metabolites at t30 and t120 under control conditions and after addition of antibiotic compounds. The values displayed are the differences in concentrations of each metabolite relative to those at t0 and normalized to the OD of the bacterial suspension at the respective sampling time. Columns are colored according to the antibiotic stress, as follows: gray, control; red, ciprofloxacin; green, erythromycin; purple, fosfomycin; blue, vancomycin; and orange, ampicillin. Data are shown as mean values ± SD for quintuplicate samples. Statistical differences between control and stress conditions were considered significant (*) for P values of ≤0.01.
FIG 6
FIG 6
Transmission electron micrographs of S. aureus HG001 cells grown in RPMI medium. Staphylococcal cells were grown without any stress for 120 min after an OD of 0.5 was reached (A), or staphylococcal cells were exposed to vancomycin (B) or ampicillin (C) for 120 min. Bars, 200 nm.

References

    1. Stubbings W, Labischinski H. 2009. New antibiotics for antibiotic-resistant bacteria. F1000 Biol. Rep. 1:40. 10.3410/B1-40. - DOI - PMC - PubMed
    1. Brown DG, Lister T, May-Dracka TL. 2014. New natural products as new leads for antibacterial drug discovery. Bioorg. Med. Chem. Lett. 24:413–418. 10.1016/j.bmcl.2013.12.059. - DOI - PubMed
    1. Kuroda M, Kuroda H, Oshima T, Takeuchi F, Mori H, Hiramatsu K. 2003. Two-component system VraSR positively modulates the regulation of cell-wall biosynthesis pathway in Staphylococcus aureus. Mol. Microbiol. 49:807–821. 10.1046/j.1365-2958.2003.03599.x. - DOI - PubMed
    1. Utaida S, Dunman PM, Macapagal D, Murphy E, Projan SJ, Singh VK, Jayaswal RK, Wilkinson BJ. 2003. Genome-wide transcriptional profiling of the response of Staphylococcus aureus to cell-wall-active antibiotics reveals a cell-wall-stress stimulon. Microbiology 149:2719–2732. 10.1099/mic.0.26426-0. - DOI - PubMed
    1. Cirz RT, Jones MB, Gingles NA, Minogue TD, Jarrahi B, Peterson SN, Romesberg FE. 2007. Complete and SOS-mediated response of Staphylococcus aureus to the antibiotic ciprofloxacin. J. Bacteriol. 189:531–539. 10.1128/JB.01464-06. - DOI - PMC - PubMed

Publication types

MeSH terms