. 2014 Dec;24(12):1918-31.
doi: 10.1101/gr.171645.113. Epub 2014 Sep 15.

Population and single-cell genomics reveal the Aire dependency, relief from Polycomb silencing, and distribution of self-antigen expression in thymic epithelia

Affiliations

Population and single-cell genomics reveal the Aire dependency, relief from Polycomb silencing, and distribution of self-antigen expression in thymic epithelia

Stephen N Sansom et al. Genome Res. 2014 Dec.

Abstract

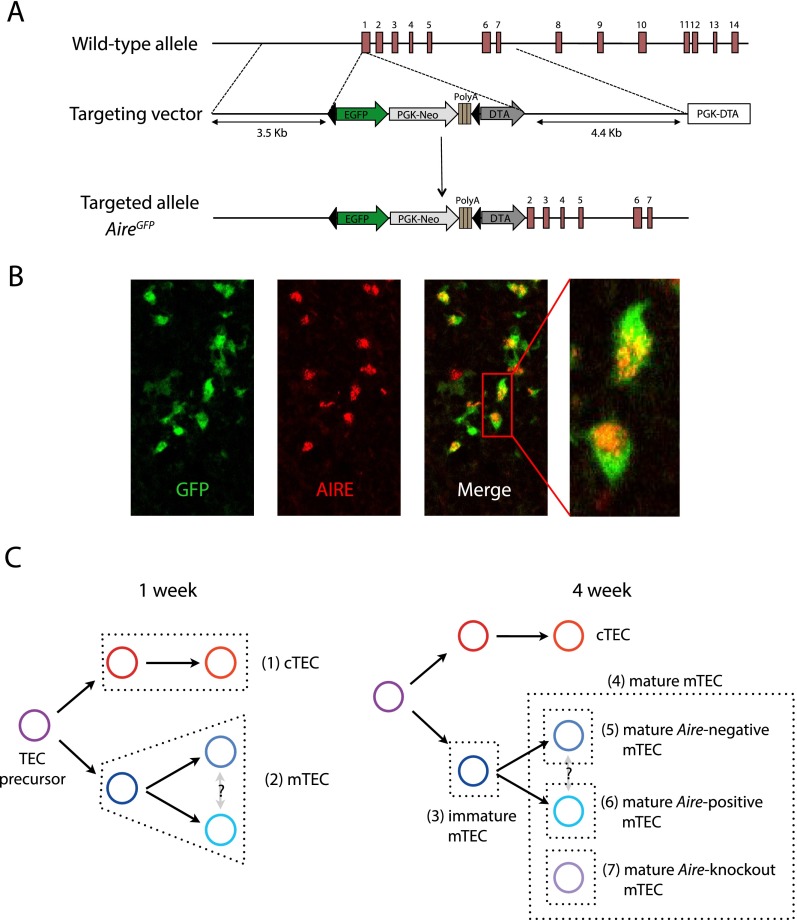
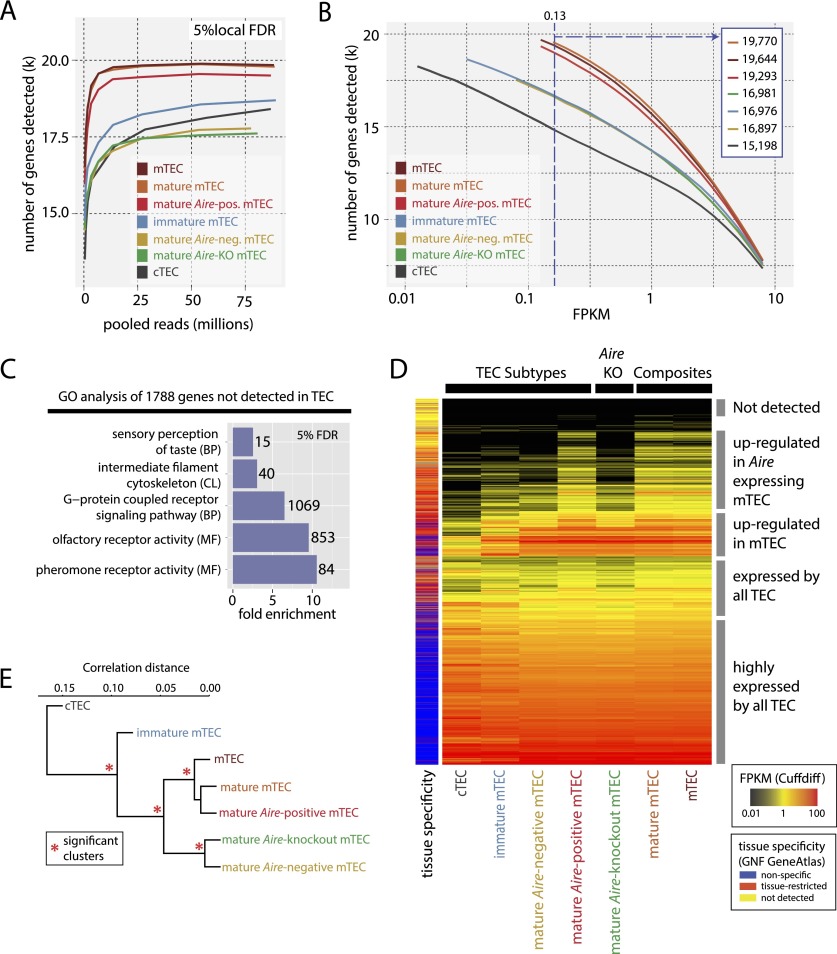
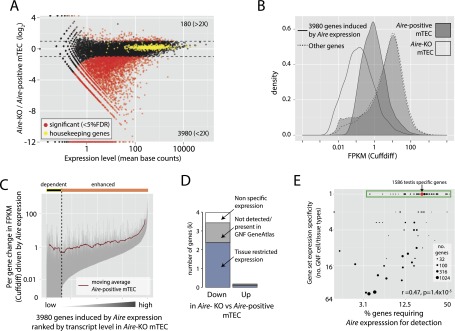
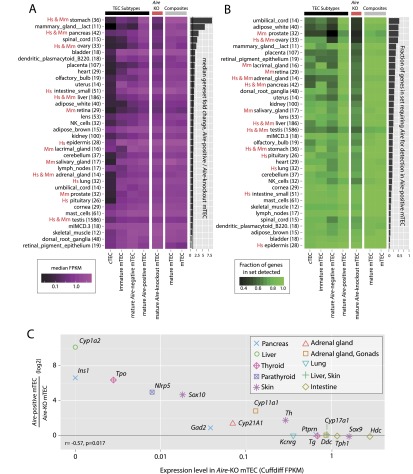
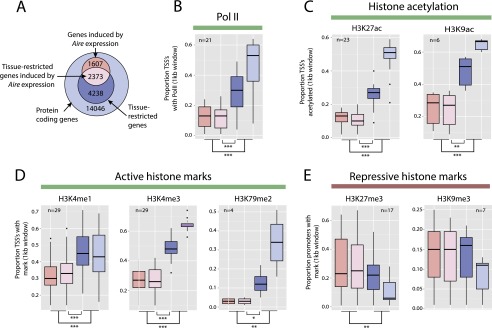
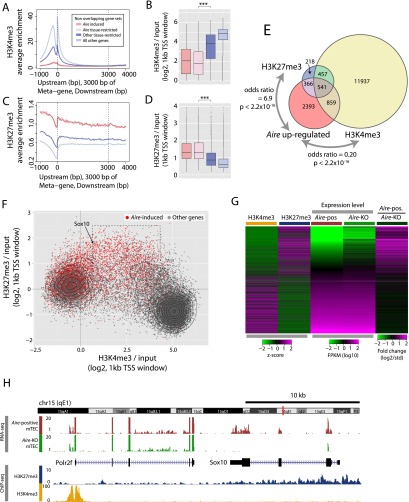
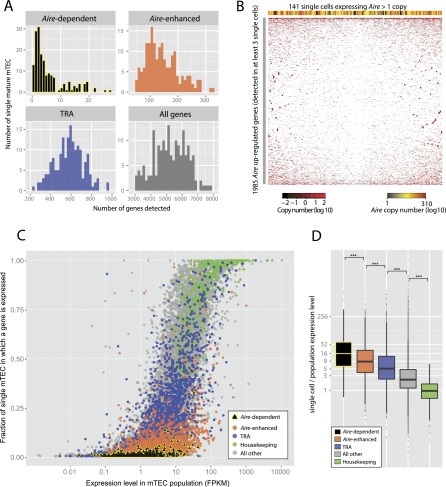
Promiscuous gene expression (PGE) by thymic epithelial cells (TEC) is essential for generating a diverse T cell antigen receptor repertoire tolerant to self-antigens, and thus for avoiding autoimmunity. Nevertheless, the extent and nature of this unusual expression program within TEC populations and single cells are unknown. Using deep transcriptome sequencing of carefully identified mouse TEC subpopulations, we discovered a program of PGE that is common between medullary (m) and cortical TEC, further elaborated in mTEC, and completed in mature mTEC expressing the autoimmune regulator gene (Aire). TEC populations are capable of expressing up to 19,293 protein-coding genes, the highest number of genes known to be expressed in any cell type. Remarkably, in mouse mTEC, Aire expression alone positively regulates 3980 tissue-restricted genes. Notably, the tissue specificities of these genes include known targets of autoimmunity in human AIRE deficiency. Led by the observation that genes induced by Aire expression are generally characterized by a repressive chromatin state in somatic tissues, we found these genes to be strongly associated with H3K27me3 marks in mTEC. Our findings are consistent with AIRE targeting and inducing the promiscuous expression of genes previously epigenetically silenced by Polycomb group proteins. Comparison of the transcriptomes of 174 single mTEC indicates that genes induced by Aire expression are transcribed stochastically at low cell frequency. Furthermore, when present, Aire expression-dependent transcript levels were 16-fold higher, on average, in individual TEC than in the mTEC population.


Figures

Figure 1.
Figure 1.
Generation of AireGFP/+ mice. (A) The genomic Aire locus (top), with the targeting construct (middle), and the targeted locus (bottom). Red rectangles with numbers indicate exons and black triangles indicate loxP sites. The PGK neo cassette in the targeting construct is followed by triple poly(A) signals to prevent further transcriptional elongation. (B) Immunofluorescence analysis of thymus sections of AireGFP/+ mice for GFP (green) and AIRE (red). (C) The basic scheme of TEC differentiation and the identification of individual TEC populations. Seven (1–7) distinct TEC populations were sorted from thymic tissue isolated from wild-type C57BL/6, AireGFP/+, and AireGFP/GFP mice (Supplemental Table 1; Supplemental Fig. 1). To ensure that the distinct mTEC subsets had fully differentiated during post-natal maturation in the presence of regular thymopoiesis and that these cells were sufficiently abundant for analysis (Irla et al. 2008), we collected the diverse mTEC populations from 4-wk-old animals, whereas cTEC and total mTEC were sorted from mice at 1 wk of age.
Figure 2.
Figure 2.
RNA-seq analysis reveals the full extent of PGE in TEC. (A) The number of genes detected in each FACS sorted TEC population at a local FDR of 5% (see Methods; Supplemental Fig. 3; Supplemental Table 2) as a function of read depth (pooled replicates) indicates that read depth was not limiting for most of the TEC populations. (B) The number of genes detected in the TEC populations at different FPKM thresholds. The left-hand start of the solid lines indicates the expression level that corresponds to a local FDR of 5% for a given TEC population (see also Supplemental Fig. 3C). The vertical blue dashed line indicates the FPKM at which genes can be reliably detected in all TEC types (numbers of genes detected at this threshold are shown in inset). (C) Selected GO categories enriched in genes not detected in any TEC population reveal a striking enrichment for odorant receptors (Supplemental Fig. 5). (CL) Cellular location; (BP) biological process; (MF) molecular function. (D) Hierarchical clustering of the expression levels of all protein-coding genes in the TEC populations reveals three distinct strata of PGE. The color key to the left of the heatmap indicates the tissue specificity of genes in the GNF GeneAtlas according to the dynamic step method (Methods; Supplemental Fig. 6). (E) Hierarchical clustering of the TEC populations by gene expression correlation distance reveals four significant clusters (red asterisks, P > 0.95).
Figure 3.
Figure 3.
Aire expression positively regulates a large set of tissue-restricted genes. (A) Genes differentially expressed between mature Aire-positive mTEC and mature Aire-KO mTEC (<5% FDR, more than twofold). A set of 474 housekeeping genes (de Jonge et al. 2007) showed little change in expression, indicating the absence of a systematic bias (yellow points). (B) At the population level, Aire expression elevates target gene transcription to a median FPKM of 1. (C) Aire expression differentially up-regulates individual target genes. Each gray vertical line represents the change in FPKM of a single gene between mature Aire-KO mTEC and mature Aire-positive mTEC. Genes are ordered by increasing expression in mature Aire-KO mTEC on the x-axis, being either dependent on or enhanced by Aire expression. The red line represents the moving average of FPKM in mature Aire-positive mTEC. (D) Genes induced by Aire expression are tissue-restricted in transcription. Tissue-restricted genes were identified from the GNF GeneAtlas using the dynamic step method (Methods; Supplemental Fig. 6). (E) Degree of tissue restriction is positively correlated with the requirement for Aire expression. The fraction of genes requiring Aire expression for detection was assessed for sets of genes restricted in expression to all possible branches, nodes, and leafs of the GNF GeneAtlas sample clustering (Supplemental Fig. 6A). Only gene sets with at least 10 members are shown. The red dot indicates 1586 genes restricted in expression to testis, a tissue with a transcriptome of abnormally high complexity (Ramsköld et al. 2009) that is known to express Aire and to undertake PGE (Schaller et al. 2008).
Figure 4.
Figure 4.
Requirement for Aire reflects known AIRE deficiency pathologies. (A) The median expression level (FPKM) of sets of genes restricted in expression to single physiological samples (excluding the thymus) of the GNF GeneAtlas (based on dynamic step criteria; see Methods; Supplemental Fig. 6) (gene numbers indicated in parentheses) for each TEC population. Gene sets are sorted by the fold change in median expression level between mature Aire-positive and mature Aire-KO mTEC (accompanying bar chart). In both A and B, gene sets representing organs affected by AIRE deficiency in APS-1 (“Hs”) and the corresponding mouse model (“Mm”) are indicated. (B) The fraction of the same sets of genes that are detectable (<5% local FDR) in each TEC population (see Methods; Supplemental Fig. 3); gene sets are sorted by the increase in the fraction of these genes detected in mature Aire-positive mTEC compared to Aire-KO TEC. (C) Relative expression of known APS-1 autoantigens in mature Aire-positive wild-type and knockout TEC (Shikama et al. 2009). Induction by Aire expression is significantly negatively correlated with the transcriptional level of these genes in mature Aire-KO mTEC.
Figure 5.
Figure 5.
Genes induced by Aire expression are characterized by a repressive chromatin state in somatic tissues. (A) Genes were divided into sets comprising Aire expression-induced (light pink) or Aire expression-independent TRAs (dark blue), other genes induced by Aire expression (dark pink), and all other genes (light blue). The proportion of genes in each of these sets with TSS overlapping Mouse ENCODE ChIP-seq peaks in various tissue and cell types was assessed. (B) Box and whisker plots show the distribution of proportions of the four gene sets (see panel A) overlapping RNA polymerase II (Pol II) ChIP-seq calls from 21 Mouse ENCODE samples. The TSS of tissue-restricted genes induced by Aire expression overlap significantly less frequently with Pol II binding sites than those of other TRAs. A similar pattern was observed for histone acetylation (C) and active histone marks (D). In contrast, the TSS of genes induced by Aire expression show significantly greater overlap with H3K27me3 across 17 Mouse ENCODE samples (E). The n-values represent the number of Mouse ENCODE samples analyzed. (*) P < 0.05, (**) P < 0.01, (***) P < 0.001, using the Mann-Whitney U-test. Colors as in A.
Figure 6.
Figure 6.
Aire expression is associated with transcription of Polycomb silenced genes in mTEC. (A) Metagene profiles of the average normalized enrichment of H3K4me3 against input for sets of genes distinguished by Aire dependence and tissue specificity. (B) Boxplots of the median enrichment of H3K4me3 at the TSS of these sets of genes. (C,D) The results of the corresponding analysis for H3K27me3 marks. In B and D, *** indicates a significance level of P < 0.001 using the Mann-Whitney U-test. (E) The association of genes up-regulated by Aire expression (>2×, FDR < 0.05, Aire-positive vs. Aire-knockout mTEC) with genes whose TSS (1-kb centered windows) showed an average (n = 2) twofold or greater enrichment for H3K27me3 or H3K4me3 marks over input. Stated P-values were calculated using Fisher’s exact test. (F) Enrichment of H3K4me3 and H3K27me3, respectively, for the TSS of all protein-coding genes. Those induced by Aire expression are highlighted in red. The dashed box highlights a subset of genes induced by Aire expression whose TSS show enrichments for both modifications. (G) Genes induced by Aire expression are generally weakly transcribed in Aire-KO mTEC and have relatively low H3K4me3 enrichment scores and relatively high H3K27me3 enrichment scores. The heatmap shows all genes ordered by their ratio of expression in mature Aire-positive and knockout TEC. (H) The chromatin state and expression of APS-1 autoantigen ortholog Sox10 and Polr2f encoding a RNA Pol II subunit in mature mTEC.
Figure 7.
Figure 7.
Transcriptomic analysis of promiscuous gene expression in single TEC. (A) Single mature mTEC tend to express few genes that are dependent on or enhanced by Aire expression (as defined in Fig. 3C). The histograms show the number of genes detected in 174 single mature mTEC that expressed >3000 protein-coding genes. (B) No discernible clustering is evident from the hierarchical clustering (with optimized leaf ordering) of 141 single Aire-expressing mature mTEC (columns) and 1985 genes up-regulated by Aire expression (rows) detected in at least three of these single cells. The colored bar above the plot indicates the single-cell expression level of Aire. (C) Genes dependent on Aire expression are transcribed less frequently in single mature mTEC than are other genes. The scatter plot shows the fraction of single mature mTEC that express any given gene against the expression level of that gene determined from the mature mTEC population. (D) When transcribed in single mTEC, genes dependent on Aire expression tend to be present at a level 16-fold higher than that indicated by the population average. Before calculating the relative expression levels, single-cell gene expression levels were globally normalized against population values using a linear model. (***) P < 1 × 10⁻¹⁴, estimated using the Mann-Whitney U-test.

Similar articles

Cited by

References

    1. Abramson J, Giraud M, Benoist C, Mathis D. 2010. Aire’s partners in the molecular control of immunological tolerance. Cell 140: 123–135. - PubMed
    1. Adli M, Bernstein BE. 2011. Whole-genome chromatin profiling from limited numbers of cells using nano-ChIP-seq. Nat Protoc 6: 1656–1668. - PMC - PubMed
    1. Ahn S, Lee G, Yang SJ, Lee D, Lee S, Shin HS, Kim MC, Lee KN, Palmer DC, Theoret MR, et al. . 2008. TSCOT+ thymic epithelial cell-mediated sensitive CD4 tolerance by direct presentation. PLoS Biol 6: e191. - PMC - PubMed
    1. Alfonso R, Lutz T, Rodriguez A, Chavez JP, Rodriguez P, Gutierrez S, Nieto A. 2011. CHD6 chromatin remodeler is a negative modulator of influenza virus replication that relocates to inactive chromatin upon infection. Cell Microbiol 13: 1894–1906. - PubMed
    1. Aloia L, Di Stefano B, Di Croce L. 2013. Polycomb complexes in stem cells and embryonic development. Development 140: 2525–2534. - PubMed

Publication types

MeSH terms

Associated data