

Cerium oxide nanoparticles attenuate monocrotaline induced right ventricular hypertrophy following pulmonary arterial hypertension
- PMID: 25224369
- PMCID: PMC4758344
- DOI: 10.1016/j.biomaterials.2014.08.037
Cerium oxide nanoparticles attenuate monocrotaline induced right ventricular hypertrophy following pulmonary arterial hypertension
Abstract
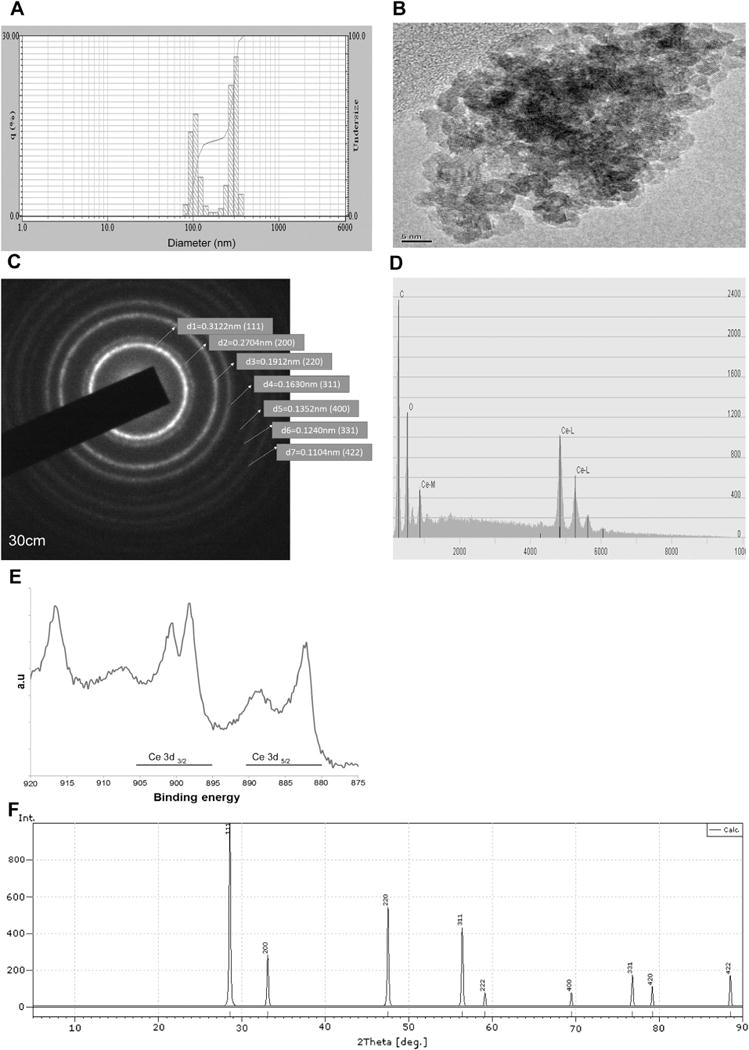
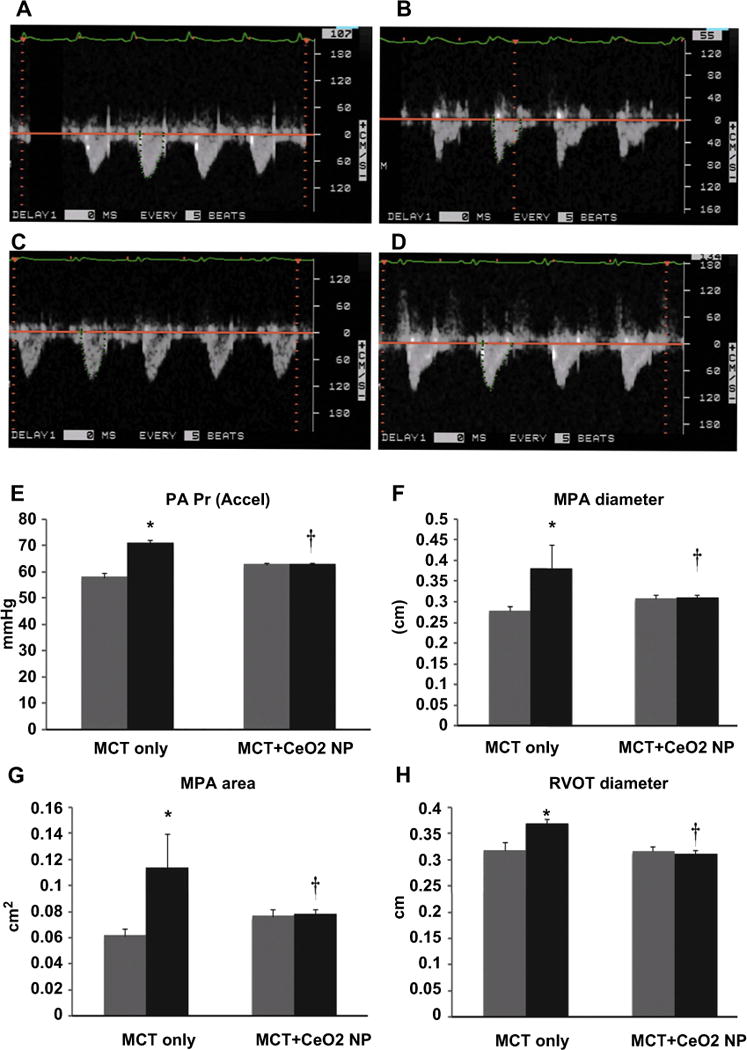
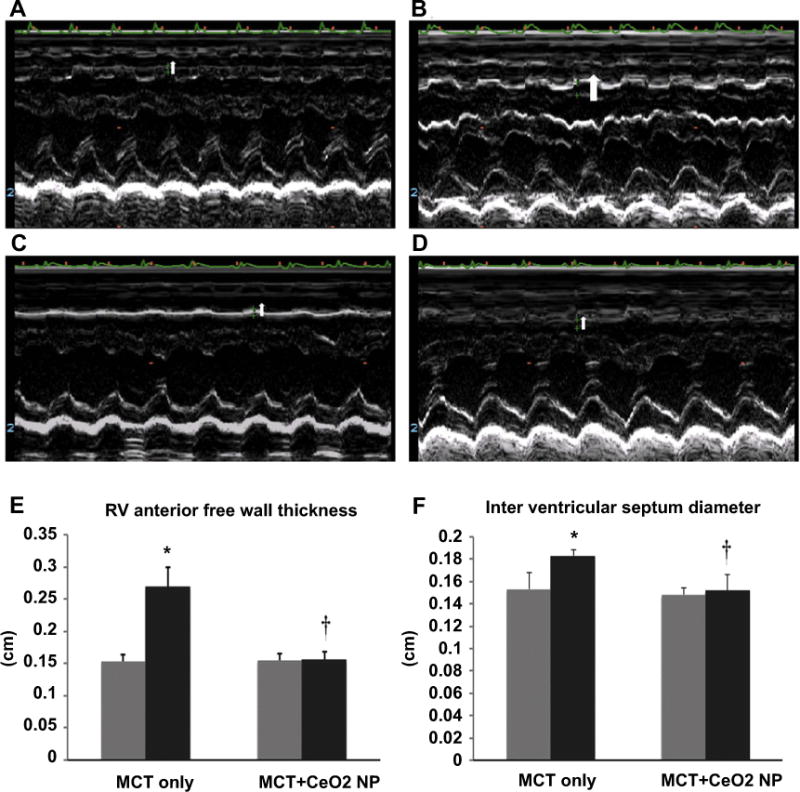
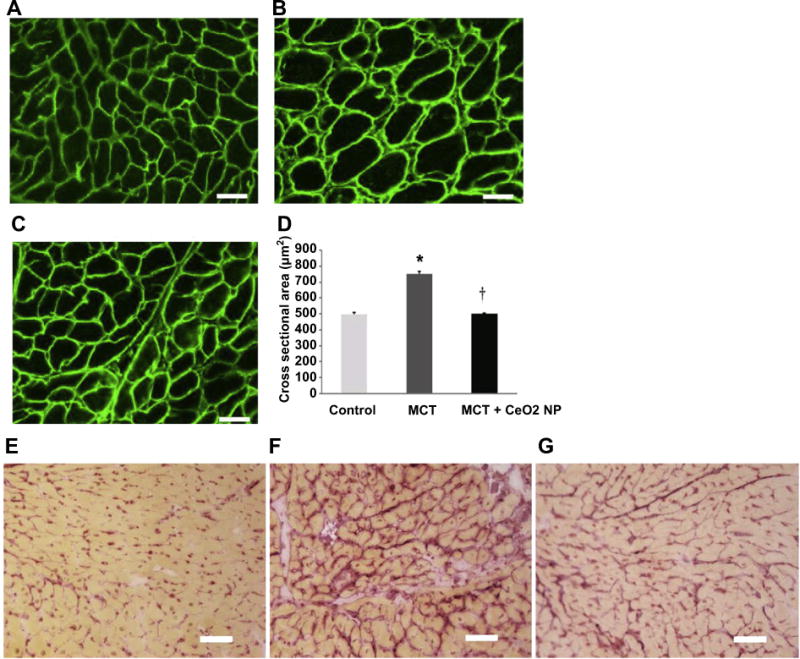
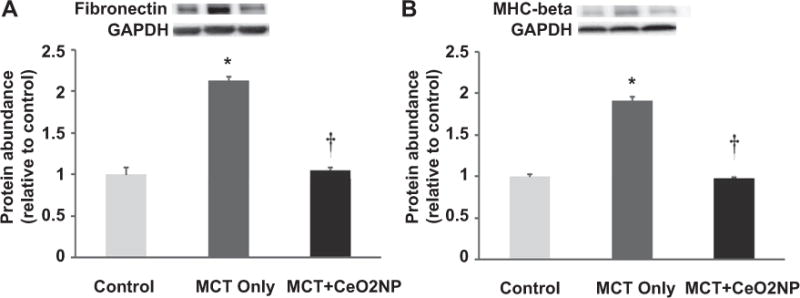
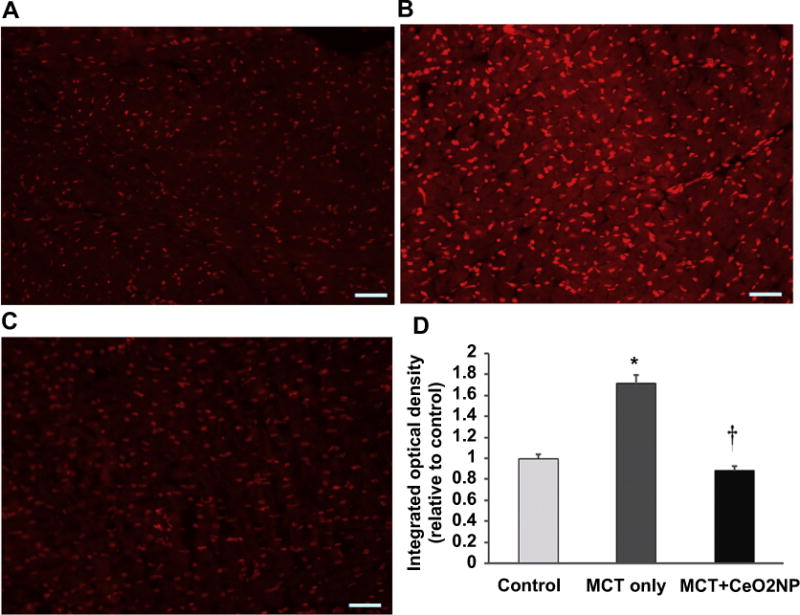
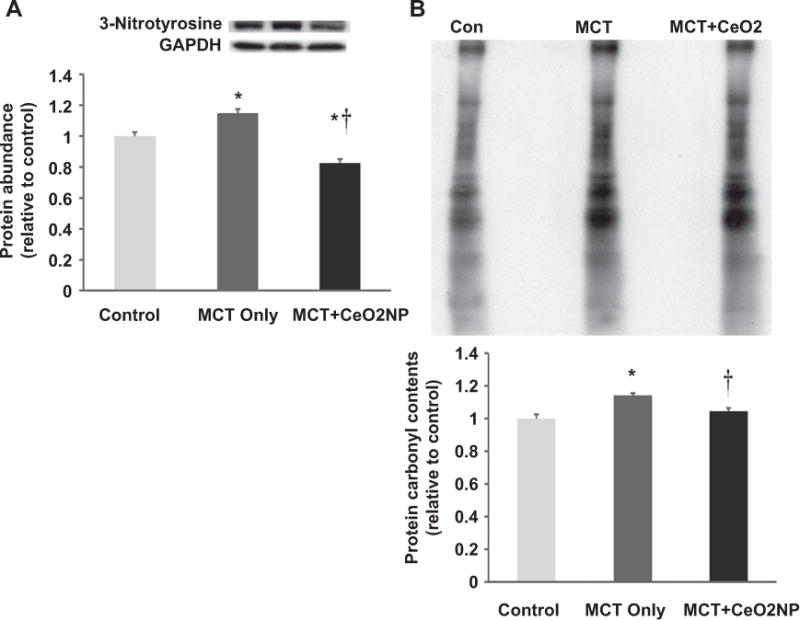
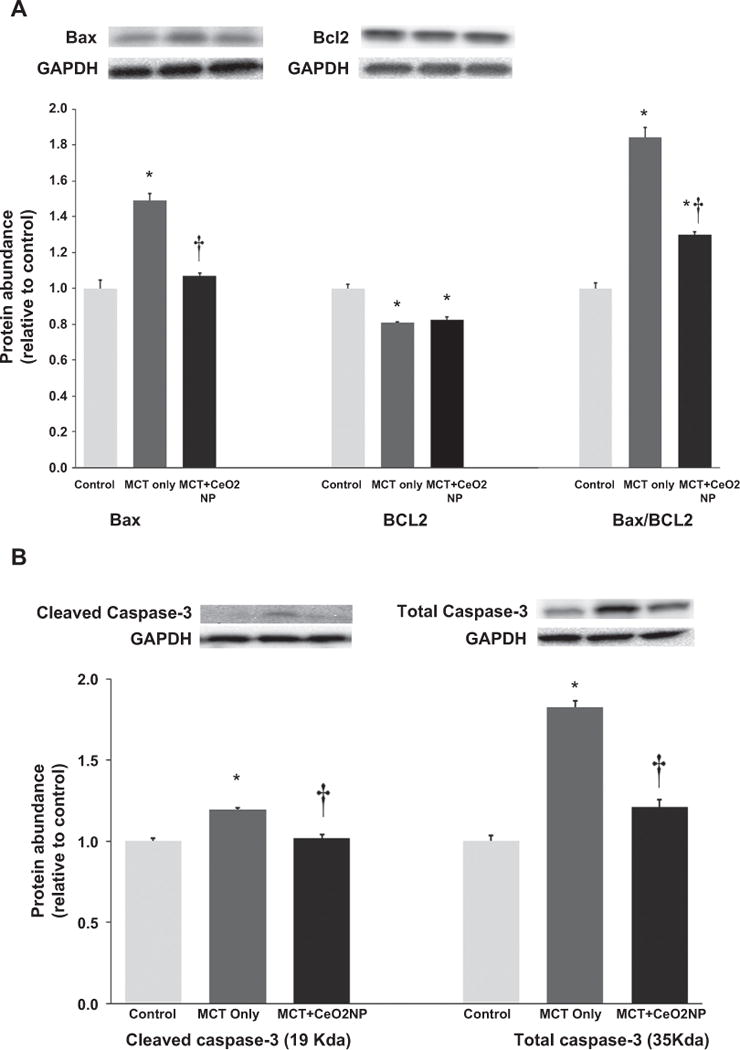
Cerium oxide (CeO2) nanoparticles have been posited to exhibit potent anti-oxidant activity which may allow for the use of these materials in biomedical applications. Herein, we investigate whether CeO2 nanoparticle administration can diminish right ventricular (RV) hypertrophy following four weeks of monocrotaline (MCT)-induced pulmonary arterial hypertension (PAH). Male Sprague Dawley rats were randomly divided into three groups: control, MCT only (60 mg/kg), or MCT + CeO2 nanoparticle treatment (60 mg/kg; 0.1 mg/kg). Compared to the control group, the RV weight to body weight ratio was 45% and 22% higher in the MCT and MCT + CeO2 groups, respectively (p < 0.05). Doppler echocardiography demonstrated that CeO2 nanoparticle treatment attenuated monocrotaline-induced changes in pulmonary flow and RV wall thickness. Paralleling these changes in cardiac function, CeO2 nanoparticle treatment also diminished MCT-induced increases in right ventricular (RV) cardiomyocyte cross sectional area, β-myosin heavy chain, fibronectin expression, protein nitrosylation, protein carbonylation and cardiac superoxide levels. These changes with treatment were accompanied by a decrease in the ratio of Bax/Bcl2, diminished caspase-3 activation and reduction in serum inflammatory markers. Taken together, these data suggest that CeO2 nanoparticle administration may attenuate the hypertrophic response of the heart following PAH.
Keywords: Cerium oxide nanoparticles; Monocrotaline; Pulmonary arterial hypertension; Right ventricular hypertrophy.
Copyright © 2014 Elsevier Ltd. All rights reserved.
Figures
Similar articles
-
Pulmonary arterial hypertension induced by a novel method: Twice-intraperitoneal injection of monocrotaline.Exp Biol Med (Maywood). 2018 Aug;243(12):995-1003. doi: 10.1177/1535370218794128. Epub 2018 Aug 12. Exp Biol Med (Maywood). 2018. PMID: 30099957 Free PMC article.
-
Cardioprotective effect of cerium oxide nanoparticles in monocrotaline rat model of pulmonary hypertension: A possible implication of endothelin-1.Life Sci. 2018 May 15;201:89-101. doi: 10.1016/j.lfs.2018.03.045. Epub 2018 Mar 26. Life Sci. 2018. PMID: 29588134
-
Perillyl alcohol suppresses monocrotaline-induced pulmonary arterial hypertension in rats via anti-remodeling, anti-oxidant, and anti-inflammatory effects.Clin Exp Hypertens. 2021 Apr 3;43(3):270-280. doi: 10.1080/10641963.2020.1860080. Epub 2020 Dec 15. Clin Exp Hypertens. 2021. PMID: 33322932
-
PRX-08066, a novel 5-hydroxytryptamine receptor 2B antagonist, reduces monocrotaline-induced pulmonary arterial hypertension and right ventricular hypertrophy in rats.J Pharmacol Exp Ther. 2010 Aug;334(2):364-72. doi: 10.1124/jpet.109.165001. Epub 2010 Apr 29. J Pharmacol Exp Ther. 2010. PMID: 20430844
-
Effect of free and nanoemulsified β-caryophyllene on monocrotaline-induced pulmonary arterial hypertension.Biochim Biophys Acta Mol Cell Res. 2024 Apr;1871(4):119704. doi: 10.1016/j.bbamcr.2024.119704. Epub 2024 Mar 8. Biochim Biophys Acta Mol Cell Res. 2024. PMID: 38462075 Review.
Cited by
-
Au-modified ceria nanozyme prevents and treats hypoxia-induced pulmonary hypertension with greatly improved enzymatic activity and safety.J Nanobiotechnology. 2024 Aug 19;22(1):492. doi: 10.1186/s12951-024-02738-4. J Nanobiotechnology. 2024. PMID: 39160624 Free PMC article.
-
Recent Advances in ROS-Scavenging Metallic Nanozymes for Anti-Inflammatory Diseases: A Review.Chonnam Med J. 2023 Jan;59(1):13-23. doi: 10.4068/cmj.2023.59.1.13. Epub 2023 Jan 25. Chonnam Med J. 2023. PMID: 36794252 Free PMC article. Review.
-
Cerium oxide nanoparticles attenuate acute kidney injury induced by intra-abdominal infection in Sprague-Dawley rats.J Nanobiotechnology. 2015 Oct 24;13:75. doi: 10.1186/s12951-015-0135-z. J Nanobiotechnology. 2015. PMID: 26498824 Free PMC article.
-
Biomimetic Nanozymes Suppressed Ferroptosis to Ameliorate Doxorubicin-Induced Cardiotoxicity via Synergetic Effect of Antioxidant Stress and GPX4 Restoration.Nutrients. 2023 Feb 22;15(5):1090. doi: 10.3390/nu15051090. Nutrients. 2023. PMID: 36904089 Free PMC article.
-
Global Proteomics Deciphered Novel-Function of Osthole Against Pulmonary Arterial Hypertension.Sci Rep. 2018 Apr 3;8(1):5556. doi: 10.1038/s41598-018-23775-8. Sci Rep. 2018. PMID: 29615702 Free PMC article.
References
-
- Sztrymf B, Souza R, Bertoletti L, Jais X, Sitbon O, Price LC, et al. Prognostic factors of acute heart failure in patients with pulmonary arterial hypertension. Eur Respir J. 2010;35:1286–93. - PubMed
-
- Humbert M, Sitbon O, Chaouat A, Bertocchi M, Habib G, Gressin V, et al. Pulmonary arterial hypertension in France: results from a national registry. Am J Respir Crit Care Med. 2006;173:1023–30. - PubMed
-
- McLaughlin VV, McGoon MD. Pulmonary arterial hypertension. Circulation. 2006;114:1417–31. - PubMed
-
- Galie N, Manes A, Branzi A. Evaluation of pulmonary arterial hypertension. Curr Opin Cardiol. 2004;19:575–81. - PubMed
Publication types
MeSH terms
Substances
Grants and funding
LinkOut - more resources
Full Text Sources
Other Literature Sources
Medical
Research Materials
