Glia selectively approach synapses on thin dendritic spines
- PMID: 25225105
- PMCID: PMC4173297
- DOI: 10.1098/rstb.2014.0047
Glia selectively approach synapses on thin dendritic spines
Abstract
This paper examines the relationship between the morphological modality of 189 dendritic spines and the surrounding astroglia using full three-dimensional reconstructions of neuropil fragments. An integrative measure of three-dimensional glial coverage confirms that thin spine postsynaptic densities are more tightly surrounded by glia. This distinction suggests that diffusion-dependent synapse-glia communication near 'learning' synapses (associated with thin spines) could be stronger than that near 'memory' synapses (associated with larger spines).
Keywords: glia protection; synapses; thin spines.
Figures

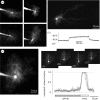
 occupied by thin, indicator-filled astrocyte processes (excluding areas containing large dendritic trunks) is measured in a Z-series of thin X–Y optical sections provided by two-photon excitation. Left panel, an image stack average (as in (a)). Right inset panels, examples of individual X–Y sections (section number reference is indicated; the effective optical width, approx. 1 µm) containing the soma; dotted line, a sampling segment (example) for the fluorescence brightness profile. Such samples were taken systematically in each X–Y section, normally by rotating the sampling segment in approximately 20° increments around the soma, throughout the Z-stack containing the soma. Plot, an example of
  measurements in eight different X–Y sections of the same astrocyte (shown on the left): brightness profiles are normalized with respect to the brightness level inside the soma (see text) within each X–Y section; grey, individual profiles; black, average. Gap junctions are blocked with carbenoxolone (Material and methods).

References
Publication types
MeSH terms
Grants and funding
LinkOut - more resources
Full Text Sources
Other Literature Sources

