

Biophysical characterization of the underappreciated and important relationship between heart rate variability and heart rate
- PMID: 25225208
- PMCID: PMC4326239
- DOI: 10.1161/HYPERTENSIONAHA.114.03782
Biophysical characterization of the underappreciated and important relationship between heart rate variability and heart rate
Abstract
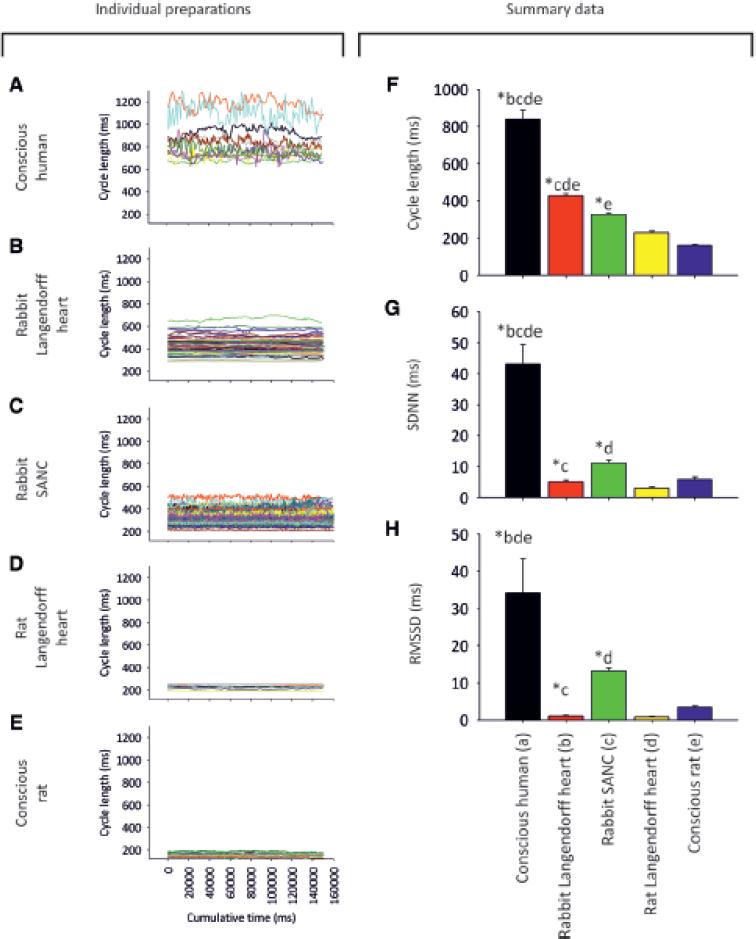
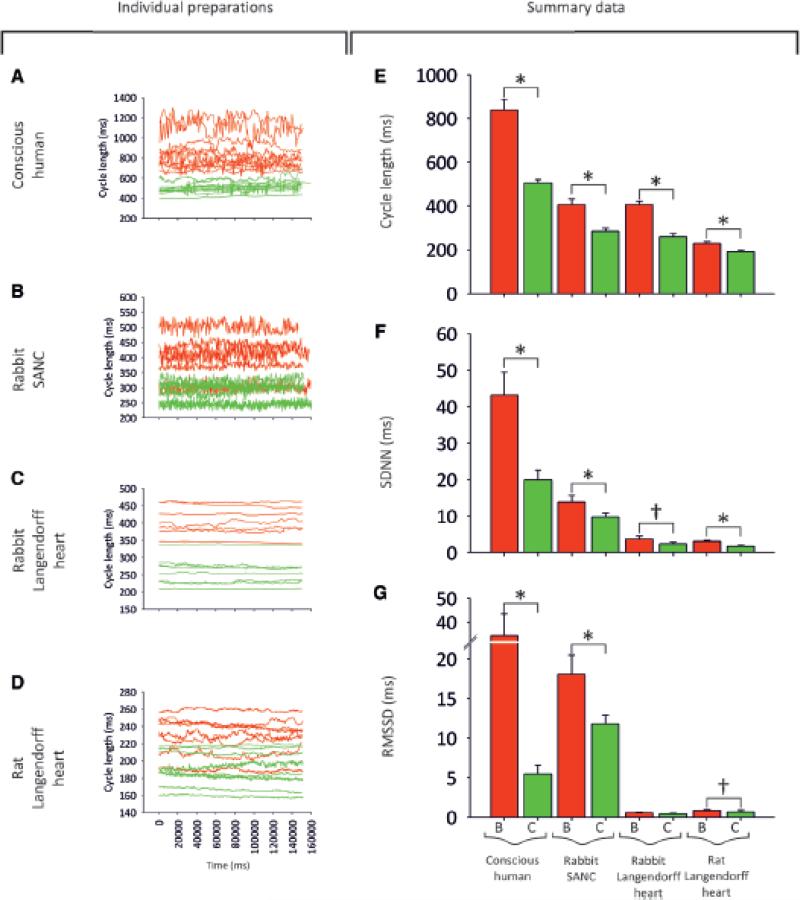
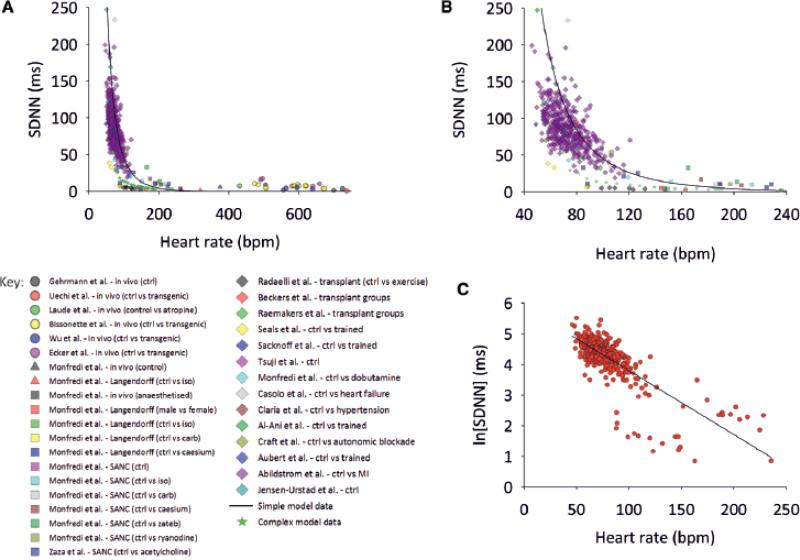
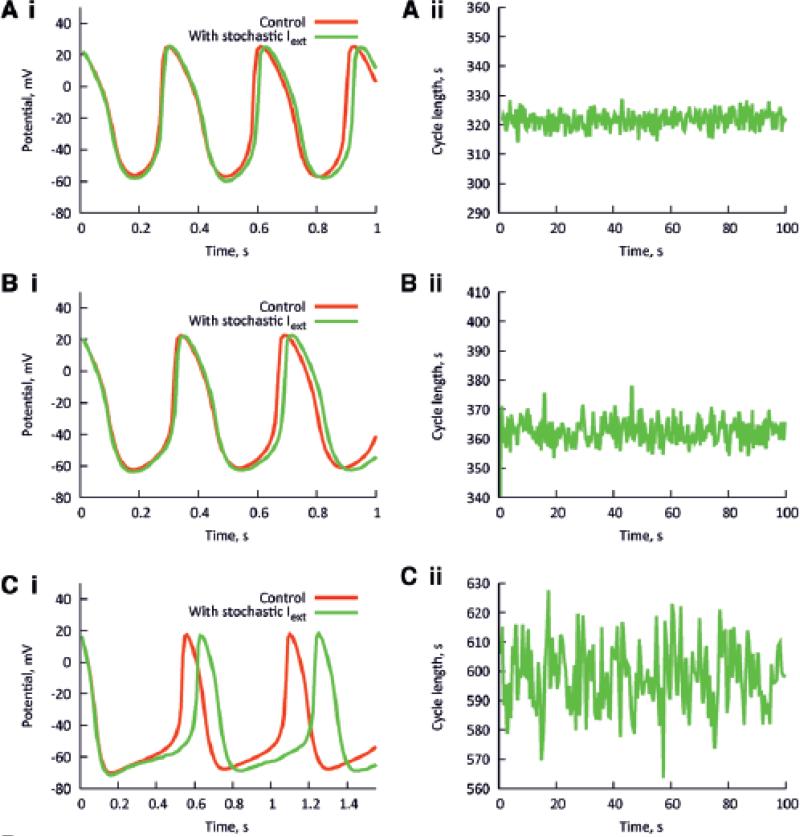
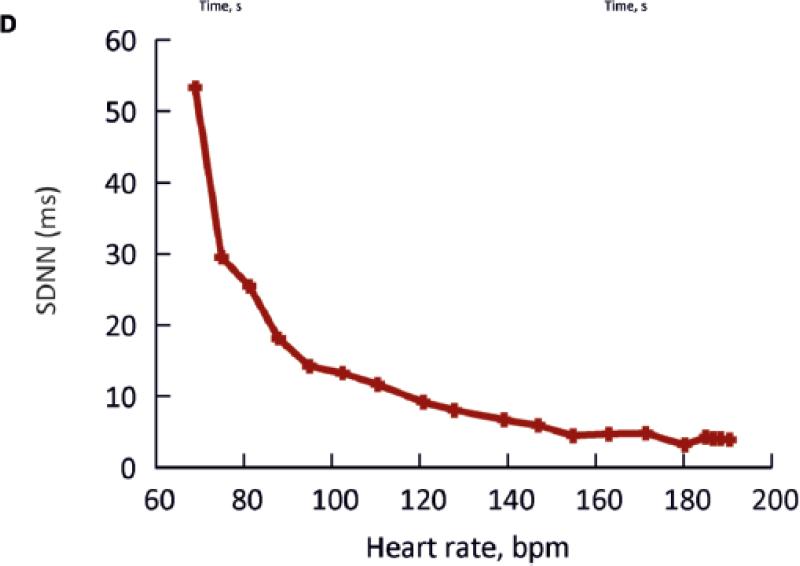
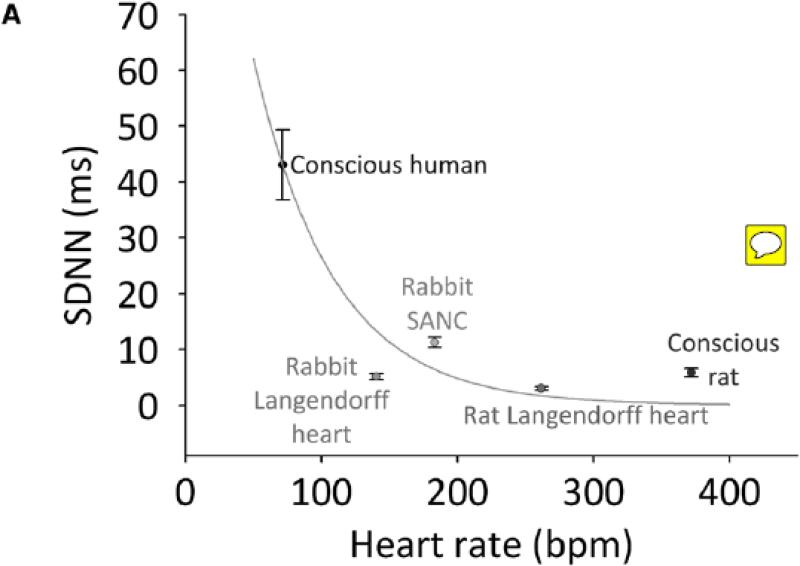
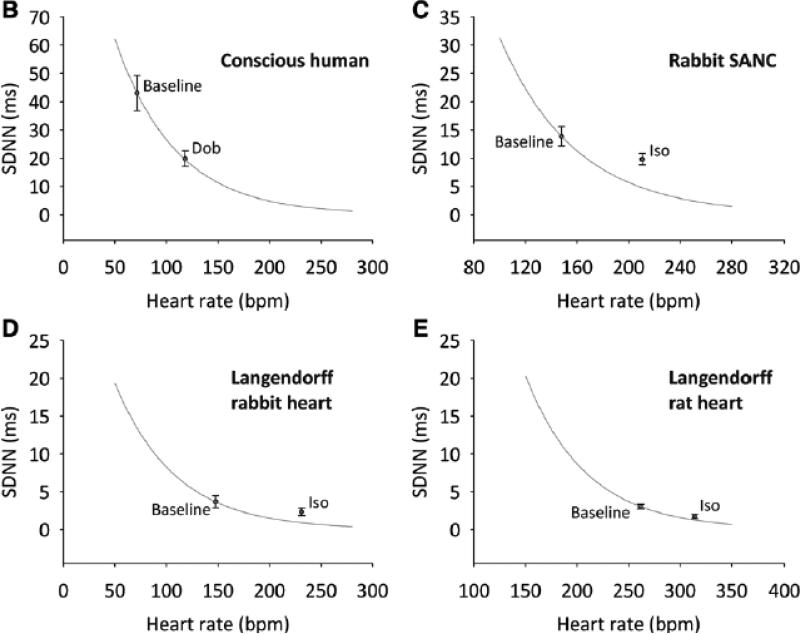
Heart rate (HR) variability (HRV; beat-to-beat changes in the R-wave to R-wave interval) has attracted considerable attention during the past 30+ years (PubMed currently lists >17 000 publications). Clinically, a decrease in HRV is correlated to higher morbidity and mortality in diverse conditions, from heart disease to fetal distress. It is usually attributed to fluctuation in cardiac autonomic nerve activity. We calculated HRV parameters from a variety of cardiac preparations (including humans, living animals, Langendorff-perfused heart, and single sinoatrial nodal cell) in diverse species, combining this with data from previously published articles. We show that regardless of conditions, there is a universal exponential decay-like relationship between HRV and HR. Using 2 biophysical models, we develop a theory for this and confirm that HRV is primarily dependent on HR and cannot be used in any simple way to assess autonomic nerve activity to the heart. We suggest that the correlation between a change in HRV and altered morbidity and mortality is substantially attributable to the concurrent change in HR. This calls for re-evaluation of the findings from many articles that have not adjusted properly or at all for HR differences when comparing HRV in multiple circumstances.
Keywords: autonomic nervous system; ion channels; physiology; sinoatrial node.
© 2014 American Heart Association, Inc.
Figures
Comment in
-
Heart rate variability: just a surrogate for mean heart rate?Hypertension. 2014 Dec;64(6):1184-6. doi: 10.1161/HYPERTENSIONAHA.114.03949. Epub 2014 Sep 15. Hypertension. 2014. PMID: 25225203 No abstract available.
-
Parsimonious Correction of Heart Rate Variability for Its Dependency on Heart Rate.Hypertension. 2016 Nov;68(5):e63-e65. doi: 10.1161/HYPERTENSIONAHA.116.08053. Epub 2016 Sep 26. Hypertension. 2016. PMID: 27672028 No abstract available.
-
Mean Heart Rate Level Does Not Affect All Heart Rate Variability Indices.Hypertension. 2017 May;69(5):e21-e22. doi: 10.1161/HYPERTENSIONAHA.117.09060. Epub 2017 Mar 6. Hypertension. 2017. PMID: 28264918 No abstract available.
References
-
- Hales S. Statistical essays: Concerning haemastaticks; or, an account of some hydraulick and hydrostatical experiments made on the blood and blood-vessels of animals. W. Innys & R. Manby; London: 1733. - PubMed
-
- Heart rate variability. Standards of measurement, physiological interpretation, and clinical use. Eur Heart J. 1996;17:354–381. - PubMed
-
- Dekker JM, Crow RS, Folsom AR, Hannan PJ, Liao D, Swenne CA, Schouten EG. Low heart rate variability in a 2-minute rhythm strip predicts risk of coronary heart disease and mortality from several causes: The aric study. Atherosclerosis risk in communities. Circulation. 2000;102:1239–1244. - PubMed
-
- Dekker JM, Schouten EG, Klootwijk P, Pool J, Swenne CA, Kromhout D. Heart rate variability from short electrocardiographic recordings predicts mortality from all causes in middle-aged and elderly men. The zutphen study. Am J Epidemiol. 1997;145:899–908. - PubMed
Publication types
MeSH terms
Grants and funding
LinkOut - more resources
Full Text Sources
Other Literature Sources
Medical
Miscellaneous
