

Review
doi: 10.1083/jcb.201405027.
Systems cell biology
Affiliations
- PMID: 25225336
- PMCID: PMC4164942
- DOI: 10.1083/jcb.201405027
Item in Clipboard
Review
Systems cell biology
J Cell Biol.
.
Abstract
Systems cell biology melds high-throughput experimentation with quantitative analysis and modeling to understand many critical processes that contribute to cellular organization and dynamics. Recently, there have been several advances in technology and in the application of modeling approaches that enable the exploration of the dynamic properties of cells. Merging technology and computation offers an opportunity to objectively address unsolved cellular mechanisms, and has revealed emergent properties and helped to gain a more comprehensive and fundamental understanding of cell biology.
© 2014 Mast et al.
Figures
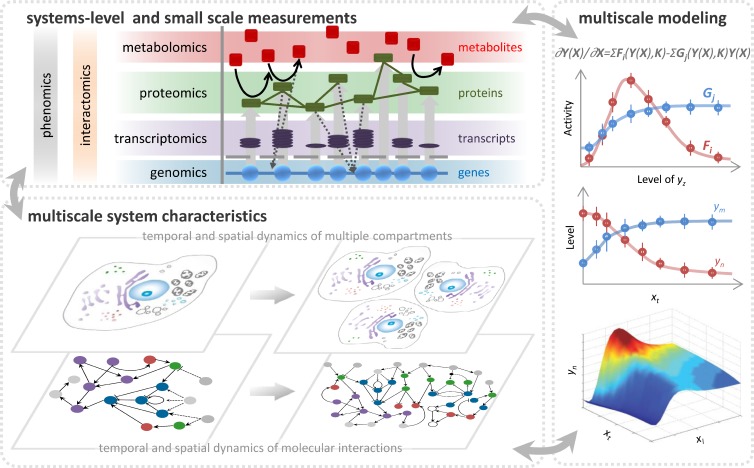
Exploring the cell as a system. Systems cell biology incorporates systems-level and small-scale measurements of information flow from all the components of the system and from all the hierarchies of the relevant temporal and spatial scale. Multiscale modeling approaches are used to infer missing parameters and visualize phenotypes as the function of multiscale system characteristics. The process is iterative, and the model is refined until it is predictive.
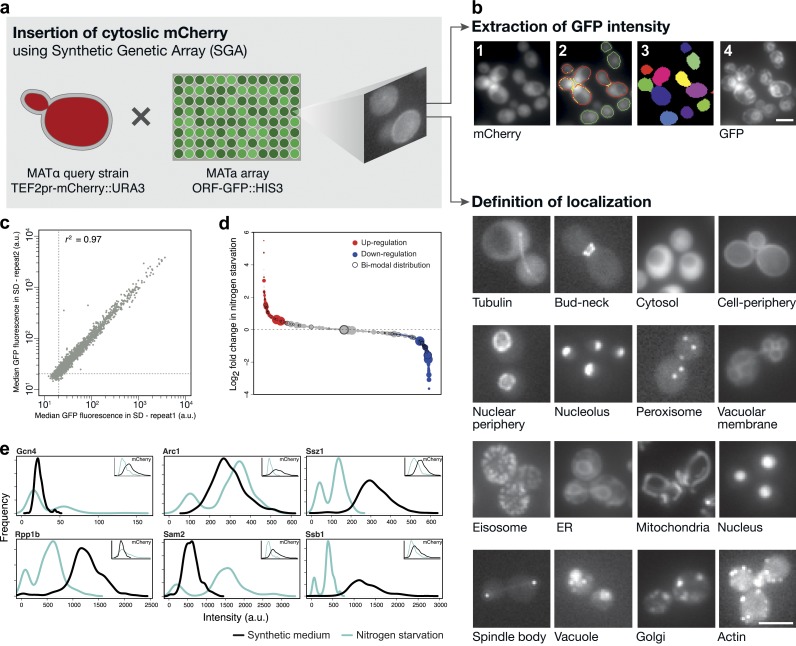
High-content microscopy screening combined with SGA technology. (a) SGA methods are used to integrate fluorescent markers into a yeast library. Depicted is the combining of two fluorescent markers, TEF2pr-mCherry, and a library where each yeast open reading frame has been C-terminally tagged with GFP. (b) Automated microscopy and image processing techniques enable the extraction of relevant information such as protein localization and intensity, which is a proxy for abundance. (c–e) Statistical methods can be used to normalize the quantified data and group proteins and classify them in relation to a particular cellular response. Reproduced from Breker et al. (2013). Bars, 5 µm.
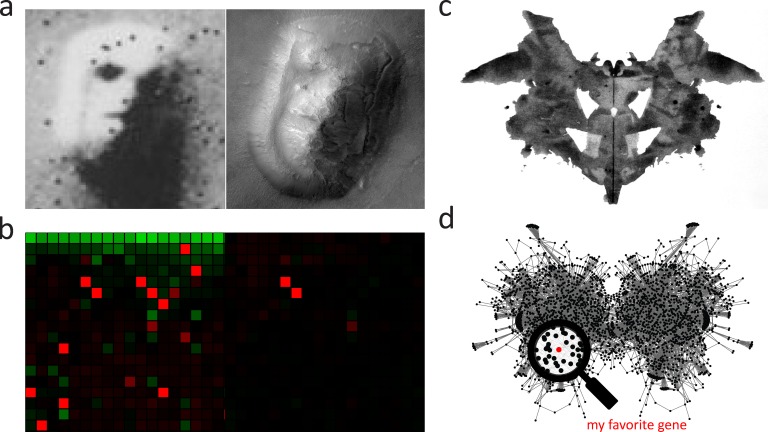
Common pitfalls in systems cell biology include pareidolia and experimenter bias. (a) Two satellite photos of an elevated area of land in the Cydonia region of Mars. The image on the left gives the illusion of a face due to the perspective of the image and its relatively low resolution. This illusion is missing from the higher-resolution image on the right. Images captured by the National Aeronautics and Space Administration (NASA). (b) Results from an SGA experiment before (left) and after (right) statistical normalization of the data reflect the pareidolia phenomenon. (c) Rorschach blot 01 is the first in a series of ink blots used in psychological tests that evaluate a subject’s interpretation of ambiguous images for clues about their personality and mental state. Image generated by Hermann Rorschach. (d) A network diagram based on the yeast regulome (Payne and Garrels, 1997) is subject to a similar bias when a familiar node of interest is focused upon.
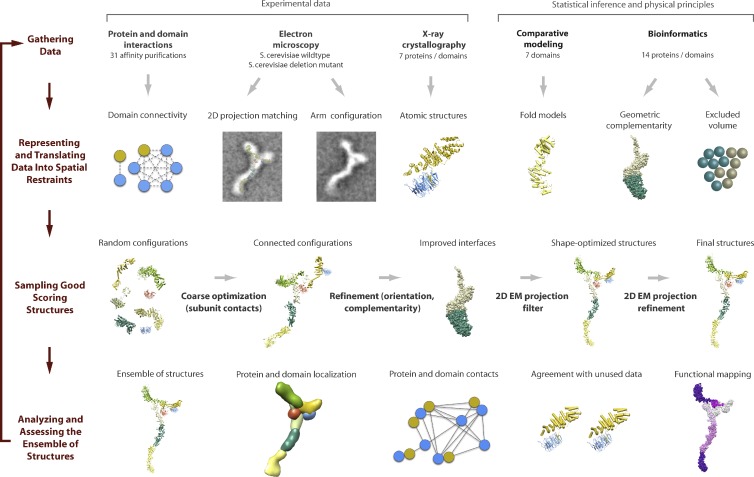
Integrative biology combining multiple experimental approaches with statistical inference and modeling approaches. Structural data on the Nup84 complex was derived from domain mapping, negative stain electron microscopy, and x-ray crystallography experiments and integrated with comparative data modeling and bioinformatics methods. The resulting structural models were then overlaid with data from functional mapping experiments. The process is refined by iteration and results in a set of possible structural configurations from which inferences can be made regarding the dynamics of this subcomplex within the much larger nuclear pore complex. Reproduced from Fernandez-Martinez et al. (2012).
References
-
- 1000 Genomes Project Consortium, Abecasis G.R., Altshuler D., Auton A., Brooks L.D., Durbin R.M., Gibbs R.A., Hurles M.E., and McVean G.A.. 2010. A map of human genome variation from population-scale sequencing. Nature. 467:1061–1073 (published erratum appears in Nature. 2011. 473:544)10.1038/nature09534 - DOI - PMC - PubMed
-
- Ackermann, B.L., Berna M.J., Eckstein J.A., Ott L.W., and Chaudhary A.K.. 2008. Current applications of liquid chromatography/mass spectrometry in pharmaceutical discovery after a decade of innovation. Annu. Rev. Anal. Chem. (Palo Alto Calif). 1:357–396 10.1146/annurev.anchem.1.031207.112855 - DOI - PubMed
Publication types
MeSH terms
Grants and funding
LinkOut - more resources
Full Text Sources
Other Literature Sources
