

Biogeography of time partitioning in mammals
- PMID: 25225371
- PMCID: PMC4183310
- DOI: 10.1073/pnas.1216063110
Biogeography of time partitioning in mammals
Abstract
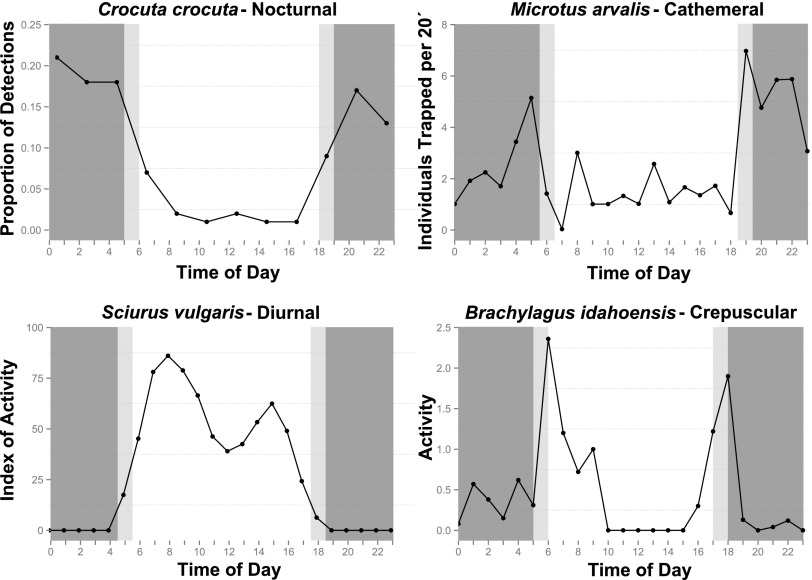
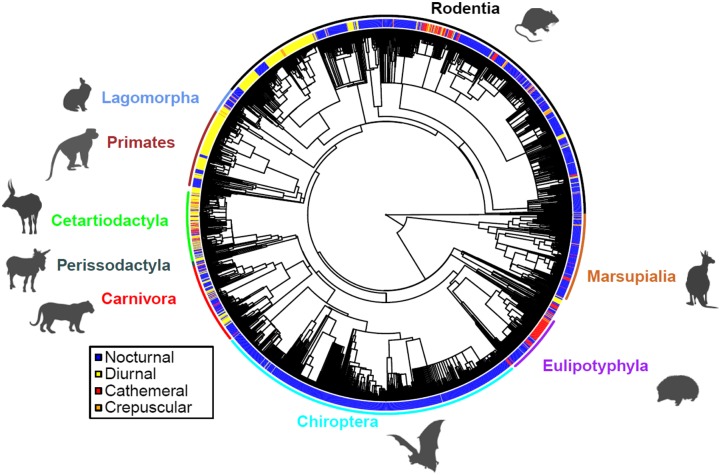
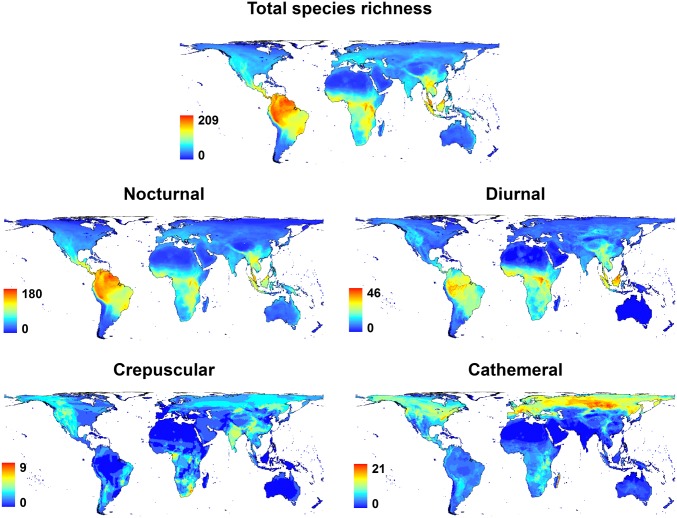
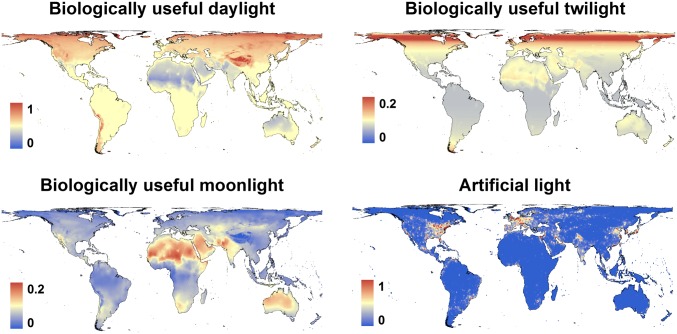
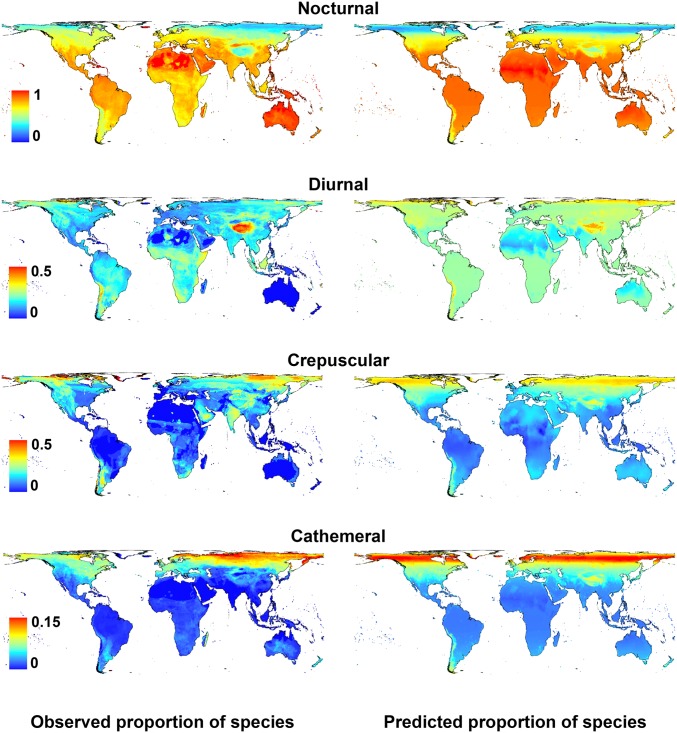
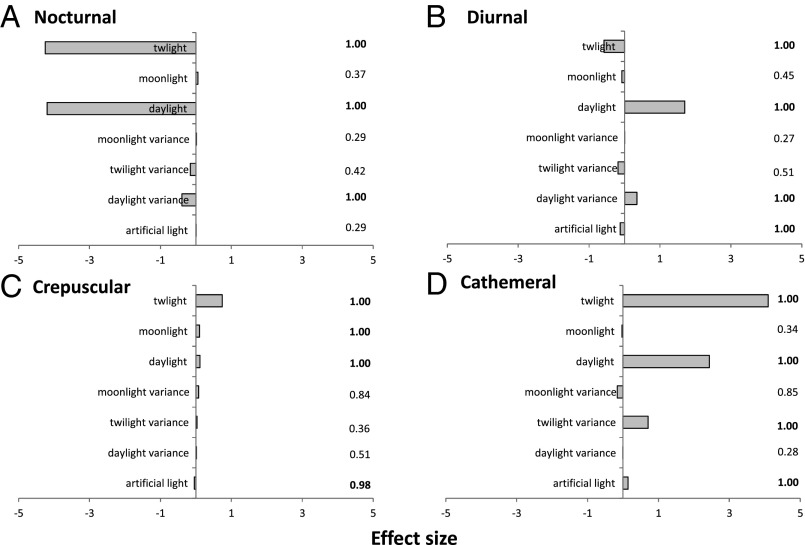
Many animals regulate their activity over a 24-h sleep-wake cycle, concentrating their peak periods of activity to coincide with the hours of daylight, darkness, or twilight, or using different periods of light and darkness in more complex ways. These behavioral differences, which are in themselves functional traits, are associated with suites of physiological and morphological adaptations with implications for the ecological roles of species. The biogeography of diel time partitioning is, however, poorly understood. Here, we document basic biogeographic patterns of time partitioning by mammals and ecologically relevant large-scale patterns of natural variation in "illuminated activity time" constrained by temperature, and we determine how well the first of these are predicted by the second. Although the majority of mammals are nocturnal, the distributions of diurnal and crepuscular species richness are strongly associated with the availability of biologically useful daylight and twilight, respectively. Cathemerality is associated with relatively long hours of daylight and twilight in the northern Holarctic region, whereas the proportion of nocturnal species is highest in arid regions and lowest at extreme high altitudes. Although thermal constraints on activity have been identified as key to the distributions of organisms, constraints due to functional adaptation to the light environment are less well studied. Global patterns in diversity are constrained by the availability of the temporal niche; disruption of these constraints by the spread of artificial lighting and anthropogenic climate change, and the potential effects on time partitioning, are likely to be critical influences on species' future distributions.
Keywords: cathemeral; night.
Conflict of interest statement
The authors declare no conflict of interest.
Figures
References
-
- Mills AM. Latitudinal gradients of biologically useful semi-darkness. Ecography. 2008;31:578–582.
-
- Baker GC, Dekker RWRJ. Lunar synchrony in the reproduction of the Moluccan megapode Megapodius wallacei. Ibis. 2000;142:382–388.
-
- Mougeot F, Bretagnolle V. Predation risk and moonlight avoidance in nocturnal seabirds. J Avian Biol. 2000;31:376–386.
-
- Hill RA. Why be diurnal? Or, why not be cathemeral? Folia Primatol (Basel) 2006;77(1-2):72–86. - PubMed
Publication types
MeSH terms
LinkOut - more resources
Full Text Sources
Other Literature Sources
Medical
