. 2014 Sep 1:2:92.
doi: 10.3389/fped.2014.00092. eCollection 2014.

GH Dysfunction in Engrailed-2 Knockout Mice, a Model for Autism Spectrum Disorders

Affiliations

GH Dysfunction in Engrailed-2 Knockout Mice, a Model for Autism Spectrum Disorders

Giovanni Provenzano et al. Front Pediatr. .

Abstract

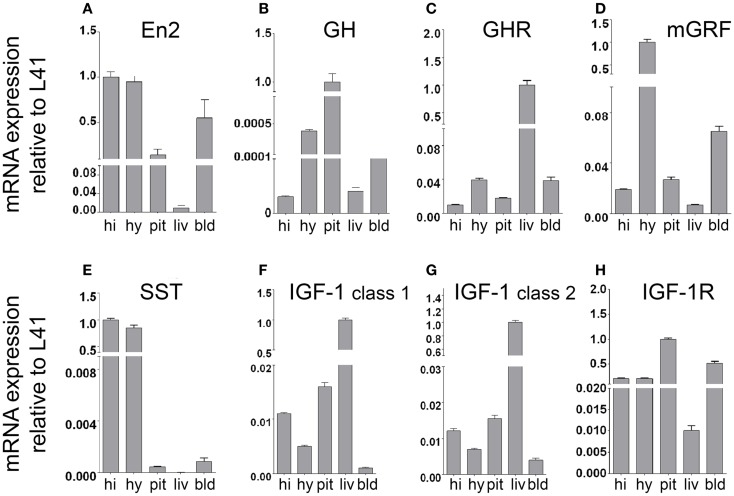
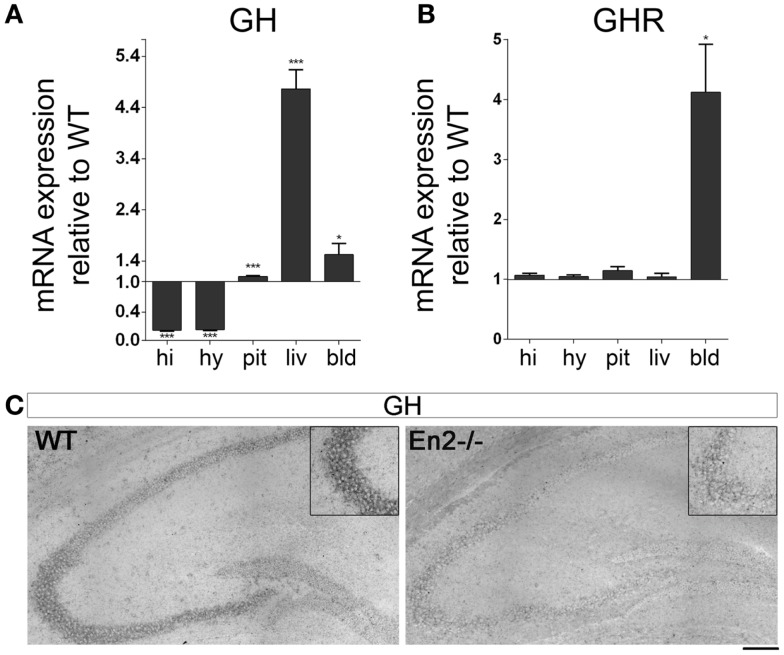
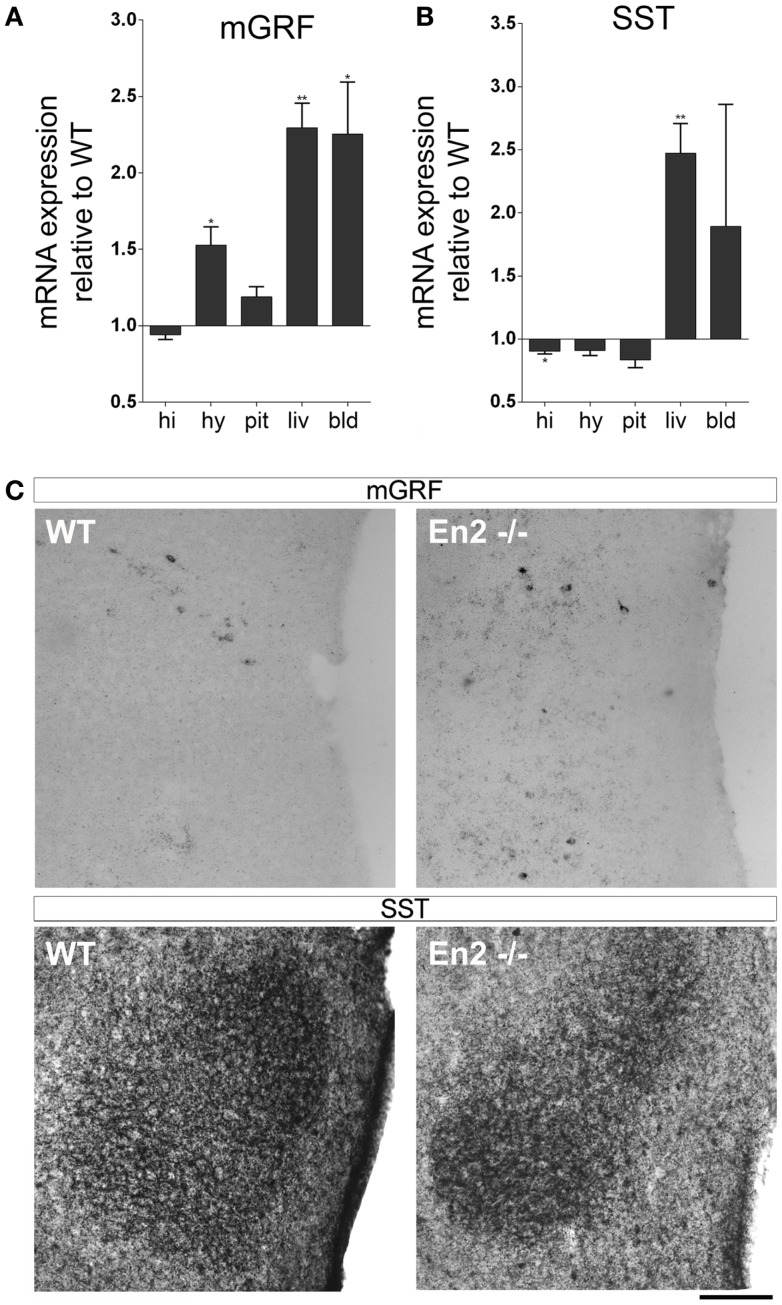
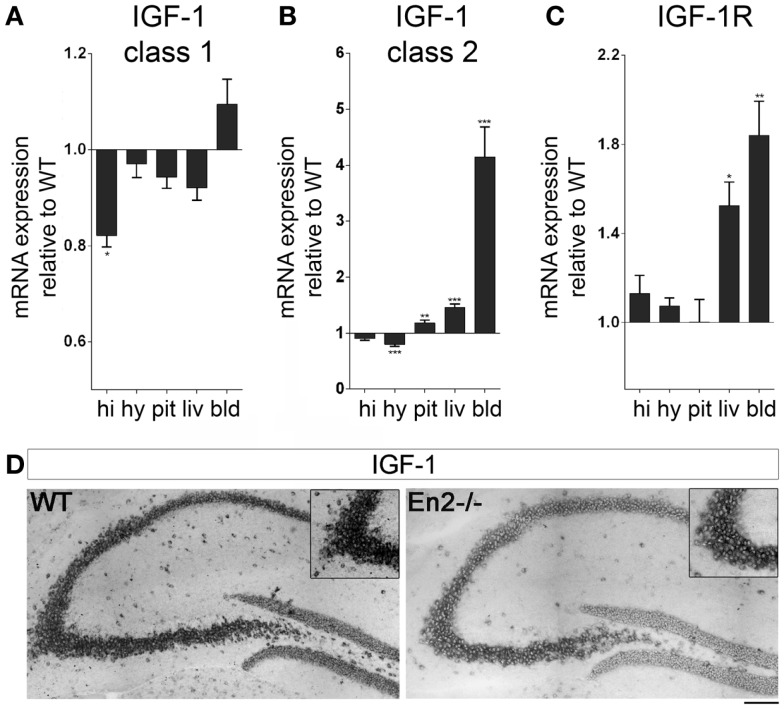
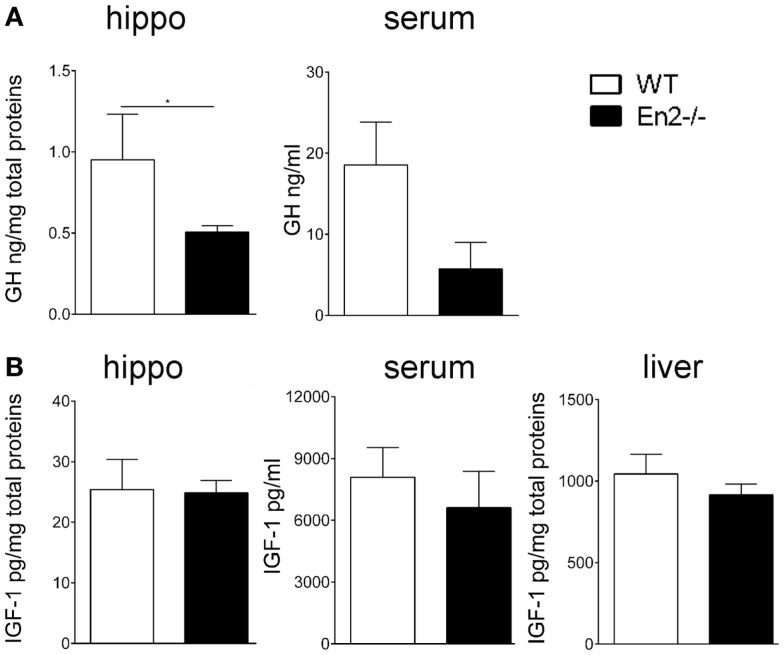
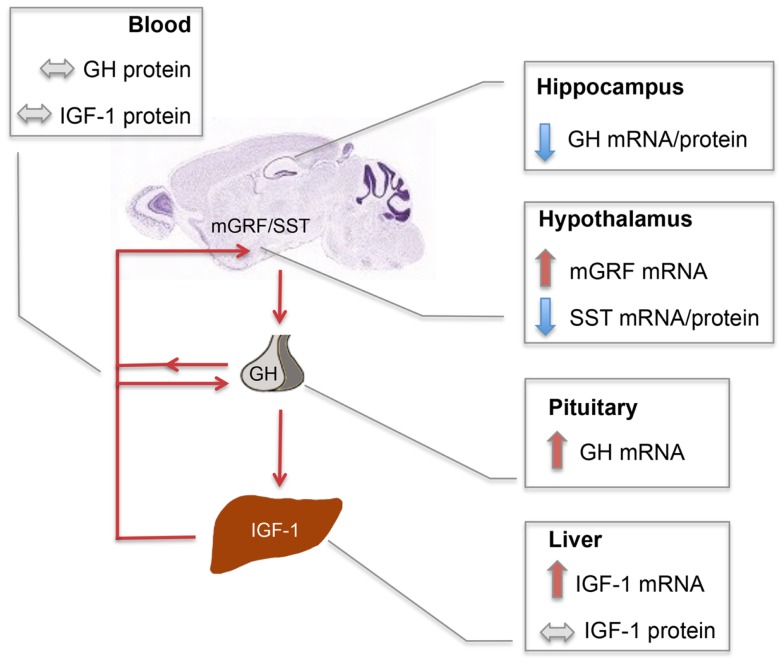
Insulin-like growth factor 1 (IGF-1) signaling promotes brain development and plasticity. Altered IGF-1 expression has been associated to autism spectrum disorders (ASD). IGF-1 levels were found increased in the blood and decreased in the cerebrospinal fluid of ASD children. Accordingly, IGF-1 treatment can rescue behavioral deficits in mouse models of ASD, and IGF-1 trials have been proposed for ASD children. IGF-1 is mainly synthesized in the liver, and its synthesis is dependent on growth hormone (GH) produced in the pituitary gland. GH also modulates cognitive functions, and altered levels of GH have been detected in ASD patients. Here, we analyzed the expression of GH, IGF-1, their receptors, and regulatory hormones in the neuroendocrine system of adult male mice lacking the homeobox transcription factor Engrailed-2 (En2 (-/-) mice). En2 (-/-) mice display ASD-like behaviors (social interactions, defective spatial learning, increased seizure susceptibility) accompanied by relevant neuropathological changes (loss of cerebellar and forebrain inhibitory neurons). Recent studies showed that En2 modulates IGF-1 activity during postnatal cerebellar development. We found that GH mRNA expression was markedly deregulated throughout the neuroendocrine axis in En2 (-/-) mice, as compared to wild-type controls. In mutant mice, GH mRNA levels were significantly increased in the pituitary gland, blood, and liver, whereas decreased levels were detected in the hippocampus. These changes were paralleled by decreased levels of GH protein in the hippocampus but not other tissues of En2 (-/-) mice. IGF-1 mRNA was significantly up-regulated in the liver and down-regulated in the En2 (-/-) hippocampus, but no differences were detected in the levels of IGF-1 protein between the two genotypes. Our data strengthen the notion that altered GH levels in the hippocampus may be involved in learning disabilities associated to ASD.

Keywords: autism spectrum disorders; growth hormone; hippocampus; insulin-like growth factor; liver; mouse model; neuroendocrine axis; pituitary gland.


Figures

Figure 1
Figure 1
mRNA expression of En2 and genes involved in the GH/IGF-1 pathway in the neuroendocrine axis of WT mice. En2 (A), GH (B), GHR (C), mGRF (D), SST (E), IGF-1 (F,G), and IGF-1R (H) mRNA expression levels in the hippocampus, hypothalamus, pituitary gland, liver, and blood, obtained by quantitative RT-PCR. For each mRNA, relative expression levels (normalized to L41) are reported on a log scale. Two different transcripts (class 1 and class 2) were analyzed for IGF-1. Values are plotted as mean ± SEM of three independent experiments. Abbreviations: hi, hippocampus; hy, hypothalamus; pit, pituitary gland; liv, liver; bld, blood (cell fraction). Other abbreviations are as in the text.
Figure 2
Figure 2
Expression of GH and GH receptor mRNAs in the neuroendocrine axis of WT and En2−/− mice. (A) GH mRNA quantitative RT-PCR. (B) GHR quantitative RT-PCR. Values are plotted as each gene/L41 comparative quantitation ratios normalized on the expression of WT (mean ± SEM of three replicates from pools of six animals per genotype; *p < 0.05, ***p < 0.001; Student’s t-test, En2−/− vs. WT). (C) Representative pictures of GH mRNA in situ hybridization on the dorsal hippocampus from WT and En2−/− mice. Insets show the CA3 subfield. Scale bar: 200 μm (whole hippocampi) and 125 μm (insets). Abbreviations are as in Figure 1.
Figure 3
Figure 3
Expression of mGRF and SST mRNAs in the neuroendocrine axis of WT and En2/− mice. (A,B) mRNA expression levels of mGRF (A) and SST (B), obtained by quantitative RT-PCR. Values are plotted as each gene/L41 comparative quantitation ratios normalized on the expression of WT (mean ± SEM of three replicates from pools of six animals per genotype; *p < 0.05, **p < 0.01; Student’s t-test, En2−/− vs. WT). (C) mGRF in situ hybridization and SST immunohistochemistry. Representative pictures show mGRF mRNA and SST protein staining in the dorsomedial and ventromedial paraventricular nuclei of the hypothalamus. Scale bar: 200 μm. Abbreviations are as in Figure 1.
Figure 4
Figure 4
Expression of IGF-1 and IGF-1R mRNAs in the neuroendocrine axis of WT and En2−/− mice. (A,B) Quantitative RT-PCR for IGF-1 class 1 (A) and class 2 (B) transcripts. (C) IGF-1R quantitative RT-PCR. Values are plotted as each gene/L41 comparative quantitation ratios normalized on the expression of WT (mean ± SEM of three replicates from pools of six animals per genotype; *p < 0.05, **p < 0.01; ***p < 0.001; Student’s t-test, En2−/− vs. WT). (D) Representative pictures of in situ hybridization for IGF-1 mRNA (both transcripts) on the dorsal hippocampus from WT and En2−/− mice. Insets show the CA3 subfield. Scale bar: 200 μm (whole hippocampi) and 125 μm (insets). Abbreviations are as in Figure 1.
Figure 5
Figure 5
Levels of GH and IGF-1 hormones in WT and En2−/− mice. (A,B) ELISA quantification of GH (A) and IGF-1 (B) levels in serum and hippocampal (hippo) and liver protein extracts, as indicated. Values are plotted as mean ± SEM (five animals per genotype, in duplicate; *p < 0.05, Student’s t-test, En2−/− vs. WT). Genotypes are as indicated.
Figure 6
Figure 6
Schematic summary of SST, mGRF, GH, and IGF-1 expression in the En2−/− neuroendocrine axis. Red and blue arrows, respectively, indicate up- and down-regulations observed in En2−/− mice as compared to WT controls. Double-arrowed gray lines indicate comparable levels between WT and En2−/− mice. Increased levels of GH and IGF-1 mRNA, respectively observed in En2−/− pituitary and liver, are not paralleled by higher levels of circulating hormones, suggesting that a complex post-translational control of GH and IGF-1 synthesis takes place in mutant mice. GH mRNA and protein levels are instead significantly down-regulated in En2−/− hippocampus. Arrowed red lines connecting different organs indicate the action of circulating hormones onto their target tissues. The mouse brain sagittal section is a Nissl stain taken from the Allen Mouse Brain Atlas (see text footnote 2). Abbreviations are as in the text.

Similar articles

Cited by

References

    1. Llorens-Martín M, Torres-Alemán I, Trejo JL. Mechanisms mediating brain plasticity: IGF1 and adult hippocampal neurogenesis. Neuroscientist (2009) 15:134–4810.1177/1073858408331371 - DOI - PubMed
    1. Sale A, Cenni MC, Ciucci F, Putignano E, Chierzi S, Maffei L. Maternal enrichment during pregnancy accelerates retinal development of the fetus. PLoS One (2007) 2:e1160.10.1371/journal.pone.0001160 - DOI - PMC - PubMed
    1. Sale A, Berardi N, Maffei L. Enrich the environment to empower the brain. Trends Neurosci (2009) 32:233–910.1016/j.tins.2008.12.004 - DOI - PubMed
    1. Guzzetta A, Baldini S, Bancale A, Baroncelli L, Ciucci F, Ghirri P, et al. Massage accelerates brain development and the maturation of visual function. J Neurosci (2009) 29:6042–5110.1523/JNEUROSCI.5548-08.2009 - DOI - PMC - PubMed
    1. Torres-Aleman I. Toward a comprehensive neurobiology of IGF-I. Dev Neurobiol (2010) 70:384–9610.1002/dneu.20778 - DOI - PubMed