

Three-dimensional enhanced lipidomics analysis combining UPLC, differential ion mobility spectrometry, and mass spectrometric separation strategies
- PMID: 25225680
- PMCID: PMC4617145
- DOI: 10.1194/jlr.D051581
Three-dimensional enhanced lipidomics analysis combining UPLC, differential ion mobility spectrometry, and mass spectrometric separation strategies
Abstract
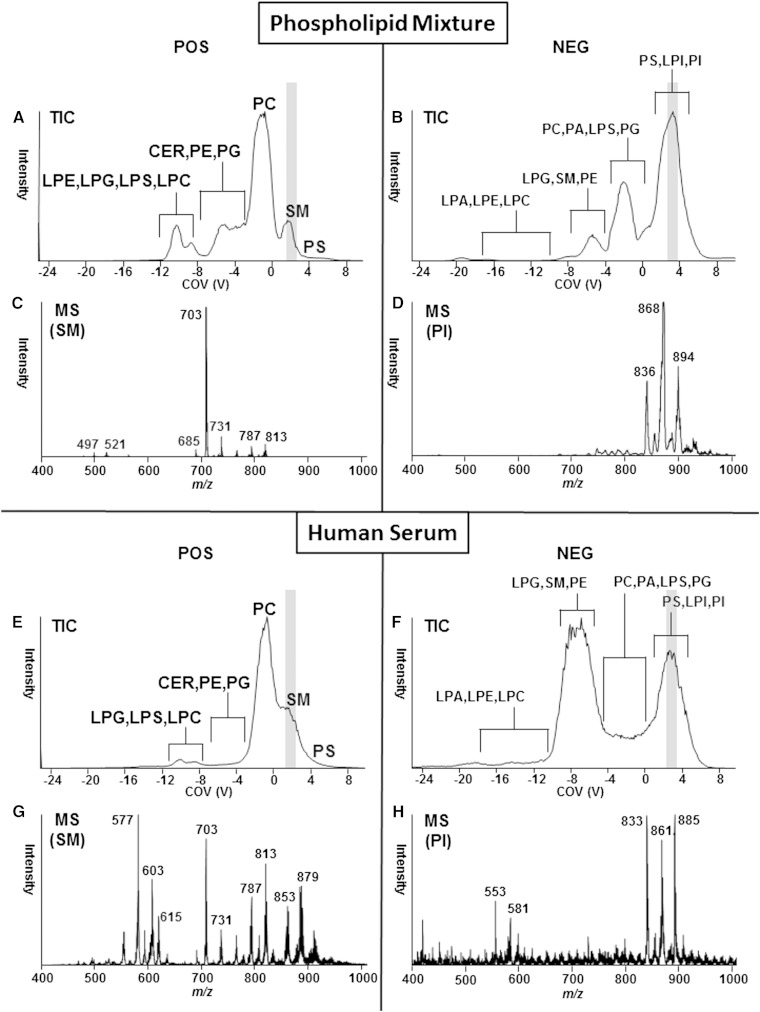
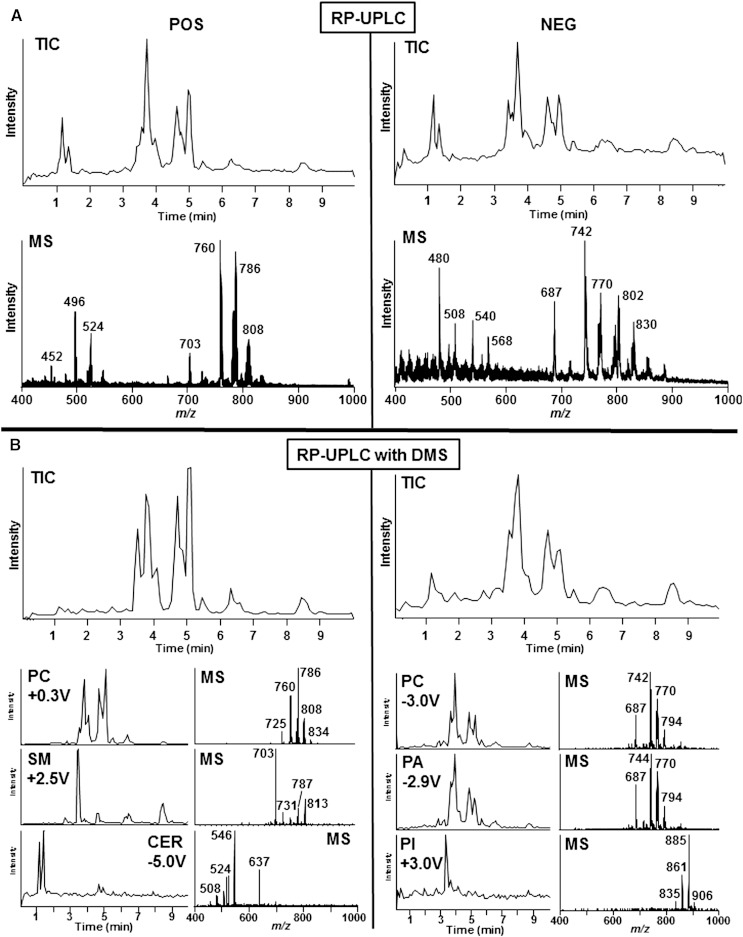
Phospholipids serve as central structural components in cellular membranes and as potent mediators in numerous signaling pathways. There are six main classes of naturally occurring phospholipids distinguished by their distinct polar head groups that contain many unique molecular species with distinct fatty acid composition. Phospholipid molecular species are often expressed as isobaric species that are denoted by the phospholipid class and the total number of carbon atoms and double bonds contained in the esterified fatty acyl groups (e.g., phosphatidylcholine 34:2). Techniques to separate these molecules exist, and each has positive and negative attributes. Hydrophilic interaction liquid chromatography uses polar bonded silica to separate lipids by polar head group but not by specific molecular species. Reversed phase (RP) chromatography can separate by fatty acyl chain composition but not by polar head group. Herein we describe a new strategy called differential ion mobility spectrometry (DMS), which separates phospholipid classes by their polar head group. Combining DMS with current LC methods enhances phospholipid separation by increasing resolution, specificity, and signal-to-noise ratio. Additional application of specialized information-dependent acquisition methodologies along with RP chromatography allows full isobaric resolution, identification, and compositional characterization of specific phospholipids at the molecular level.
Keywords: glycerophospholipids; lipid metabolism; lipid profiling.
Copyright © 2014 by the American Society for Biochemistry and Molecular Biology, Inc.
Figures


Similar articles
-
An improved SPE method for fractionation and identification of phospholipids.J Sep Sci. 2013 Feb;36(4):744-51. doi: 10.1002/jssc.201200708. Epub 2013 Jan 24. J Sep Sci. 2013. PMID: 23349108
-
A simple and universal method for the separation and identification of phospholipid molecular species.Rapid Commun Mass Spectrom. 2008 Jun;22(12):1853-62. doi: 10.1002/rcm.3562. Rapid Commun Mass Spectrom. 2008. PMID: 18470873
-
Separation and identification of phospholipid peroxidation products.Lipids. 2001 Nov;36(11):1265-75. doi: 10.1007/s11745-001-0841-2. Lipids. 2001. PMID: 11795860
-
Electrospray mass spectrometry of phospholipids.Mass Spectrom Rev. 2003 Sep-Oct;22(5):332-64. doi: 10.1002/mas.10061. Mass Spectrom Rev. 2003. PMID: 12949918 Review.
-
Multidimensional approaches in LC and MS for phospholipid bioanalysis.Bioanalysis. 2010 Jun;2(6):1109-23. doi: 10.4155/bio.10.52. Bioanalysis. 2010. PMID: 21083211 Review.
Cited by
-
Software tool for internal standard based normalization of lipids, and effect of data-processing strategies on resulting values.BMC Bioinformatics. 2019 Apr 29;20(1):217. doi: 10.1186/s12859-019-2803-8. BMC Bioinformatics. 2019. PMID: 31035918 Free PMC article.
-
Liberating Chiral Lipid Mediators, Inflammatory Enzymes, and LIPID MAPS from Biological Grease.J Biol Chem. 2016 Nov 18;291(47):24431-24448. doi: 10.1074/jbc.X116.723791. Epub 2016 Aug 23. J Biol Chem. 2016. PMID: 27555328 Free PMC article. Review.
-
Analytical separations for lipids in complex, nonpolar lipidomes using differential mobility spectrometry.J Lipid Res. 2019 Nov;60(11):1968-1978. doi: 10.1194/jlr.D094854. Epub 2019 Sep 11. J Lipid Res. 2019. PMID: 31511397 Free PMC article.
-
Evaluating lipid mediator structural complexity using ion mobility spectrometry combined with mass spectrometry.Bioanalysis. 2018 Mar 1;10(5):279-289. doi: 10.4155/bio-2017-0245. Epub 2018 Mar 1. Bioanalysis. 2018. PMID: 29494212 Free PMC article.
-
Development of LC-FAIMS-MS and its application to lipidomics study of Acinetobacter baumannii infection.J Lipid Res. 2024 Nov;65(11):100668. doi: 10.1016/j.jlr.2024.100668. Epub 2024 Oct 10. J Lipid Res. 2024. PMID: 39395788 Free PMC article.
References
-
- Loizides-Mangold U. 2013. On the future of mass-spectrometry-based lipidomics. FEBS J. 280: 2817–2829. - PubMed
-
- Wenk M. R. 2005. The emerging field of lipidomics. Nat. Rev. Drug Discov. 4: 594–610. - PubMed
-
- Dennis E. A., Brown H. A., Deems R. A., Glass C. K., Merrill A. H., Murphy R. C., Raetz R. H., Shaw W., Subramaniam S., Russel D. W., et al. 2005. The LIPID MAPS approach to lipidomics. In Functional Lipidomics. L. Feng and G. Prestwich, editors. CRC Press/Taylor & Francis Group, Boca Raton, FL. 1–15.
-
- Fenn J. B., Mann M., Meng C. K., Wong S. F., Whitehouse C. M. 1989. Electrospray ionization for mass spectrometry of large biomolecules. Science. 246: 64–71. - PubMed
-
- Yost R. A., Enke C. G. 1979. Triple quadrupole mass spectrometry for direct mixture analysis and structure elucidation. Anal. Chem. 51: 1251–1264. - PubMed
Publication types
MeSH terms
Substances
Grants and funding
LinkOut - more resources
Full Text Sources
Other Literature Sources
