

Differential microRNA expression profile between stimulated PBMCs from HIV-1 infected elite controllers and viremic progressors
- PMID: 25225963
- PMCID: PMC4165582
- DOI: 10.1371/journal.pone.0106360
Differential microRNA expression profile between stimulated PBMCs from HIV-1 infected elite controllers and viremic progressors
Abstract
Background: The emerging relationship between microRNAs (miRNA) and viral-control is a topic of interest in the field of HIV. Host-genome might play an important role in the control of viremia. The aim of this study was to assess the specific miRNA profile that could contribute to the control of HIV replication in Elite Controllers.
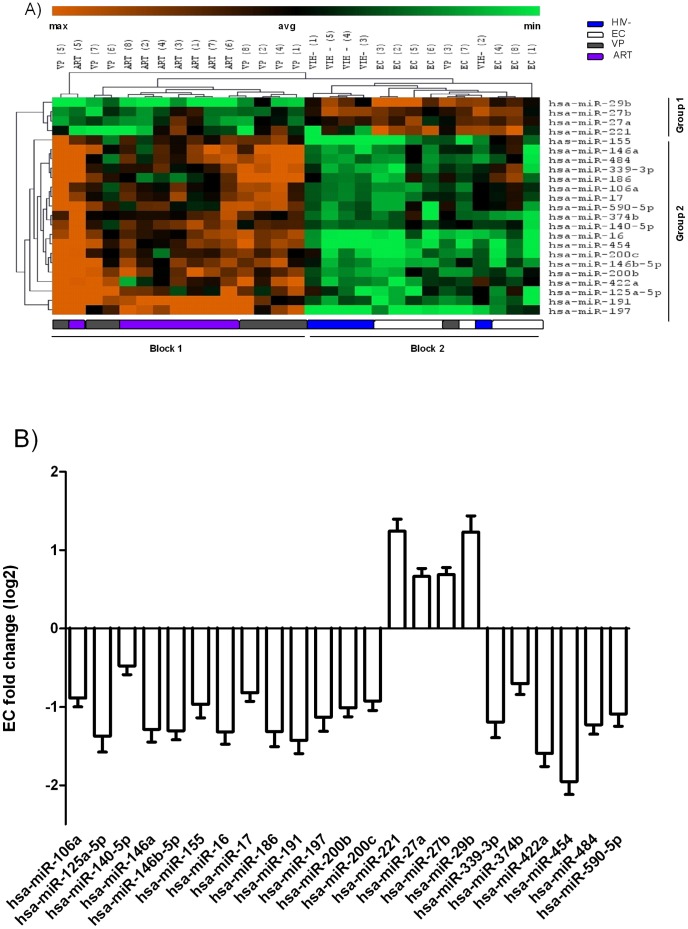
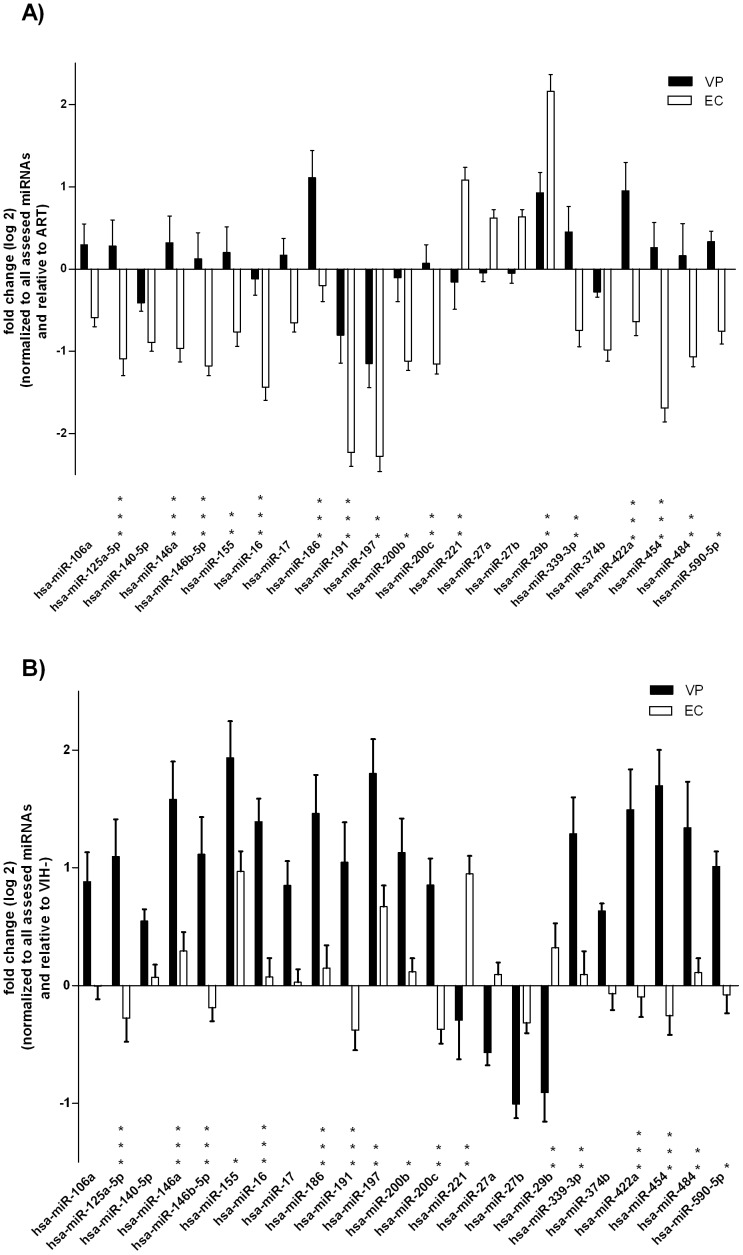
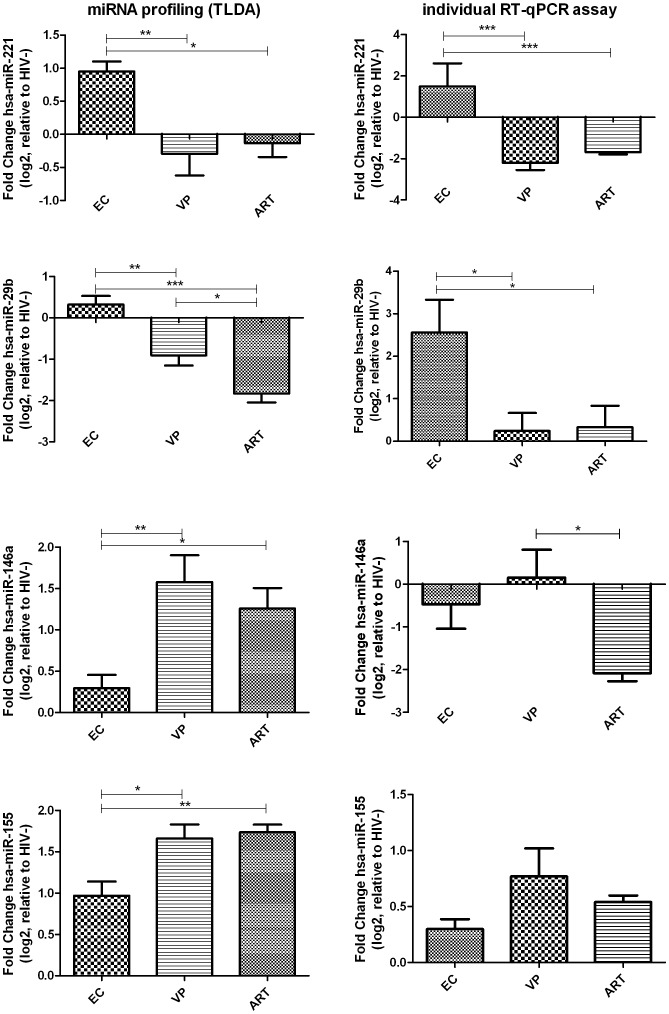
Results: After adequate normalization, expression profile of 286 human miRNAs (hsa-miR) was evaluated in phytohaemagglutinin-stimulated PBMCs from 29 individuals classified in 4 groups: 8 elite controllers (EC; viral load <50 cp/ml without treatment), 8 viremic progressors (VP; VL>5000 cp/ml without treatment), 8 patients under antiretroviral treatment (ART; VL<200 cp/ml) and 5 uninfected individuals (HIV-) through TaqMan Array Human microRNA Cards v3.0. A differential expression pattern consisting of 23 miRNAs became significantly different when comparing EC and VP. Profiling analysis segregated the population in two different blocks: while EC and HIV- clustered together in the same block (EC/HIV-_block 1), VP and ART individuals clustered together in a second block (VP/ART_block 2). Two inversely expressed miRNA patterns were determined within those two blocks: a set of 4 miRNAs (hsa-miR-221, -27a, -27b and -29b) was up-expressed in EC/HIV-_block and down-expressed in VP/ART_block while 19 miRNAs were down-expressed in block 1 and up-expressed in block 2. Differential miRNAs were successfully validated through individual RT-qPCR assays.
Conclusions: Profile in EC resembled HIV- and differentially clusters with VP and ART. Therefore, differential clustering does not rely on undetectable viremia.
Conflict of interest statement
Figures
Similar articles
-
MicroRNA Profile in CD8+ T-Lymphocytes from HIV-Infected Individuals: Relationship with Antiviral Immune Response and Disease Progression.PLoS One. 2016 May 12;11(5):e0155245. doi: 10.1371/journal.pone.0155245. eCollection 2016. PLoS One. 2016. PMID: 27171002 Free PMC article.
-
Relationships of PBMC microRNA expression, plasma viral load, and CD4+ T-cell count in HIV-1-infected elite suppressors and viremic patients.Retrovirology. 2012 Jan 12;9:5. doi: 10.1186/1742-4690-9-5. Retrovirology. 2012. PMID: 22240256 Free PMC article.
-
MicroRNA regulation and its effects on cellular transcriptome in human immunodeficiency virus-1 (HIV-1) infected individuals with distinct viral load and CD4 cell counts.BMC Infect Dis. 2013 May 30;13:250. doi: 10.1186/1471-2334-13-250. BMC Infect Dis. 2013. PMID: 23721325 Free PMC article.
-
MiRNA expression profiling in HIV pathogenesis, disease progression and response to treatment: a systematic review.Epigenomics. 2021 Oct;13(20):1653-1671. doi: 10.2217/epi-2021-0237. Epub 2021 Oct 25. Epigenomics. 2021. PMID: 34693727
-
Comparison of the Biological Basis for Non-HIV Transmission to HIV-Exposed Seronegative Individuals, Disease Non-Progression in HIV Long-Term Non-Progressors and Elite Controllers.Viruses. 2023 Jun 13;15(6):1362. doi: 10.3390/v15061362. Viruses. 2023. PMID: 37376660 Free PMC article. Review.
Cited by
-
Circulating MicroRNAs as a Tool for Diagnosis of Liver Disease Progression in People Living with HIV-1.Viruses. 2022 May 24;14(6):1118. doi: 10.3390/v14061118. Viruses. 2022. PMID: 35746590 Free PMC article. Review.
-
Plasma MicroRNA Signature Panel Predicts the Immune Response After Antiretroviral Therapy in HIV-Infected Patients.Front Immunol. 2021 Nov 23;12:753044. doi: 10.3389/fimmu.2021.753044. eCollection 2021. Front Immunol. 2021. PMID: 34887859 Free PMC article.
-
Differential miRNA plasma profiles associated with the spontaneous loss of HIV-1 control: miR-199a-3p and its potential role as a biomarker for quick screening of elite controllers.Clin Transl Med. 2021 Jul;11(7):e474. doi: 10.1002/ctm2.474. Clin Transl Med. 2021. PMID: 34323411 Free PMC article. No abstract available.
-
Identification of Host Micro RNAs That Differentiate HIV-1 and HIV-2 Infection Using Genome Expression Profiling Techniques.Viruses. 2016 May 2;8(5):121. doi: 10.3390/v8050121. Viruses. 2016. PMID: 27144577 Free PMC article.
-
Elevated expression of miR-146a correlates with high levels of immune cell exhaustion markers and suppresses cellular immune function in chronic HIV-1-infected patients.Sci Rep. 2019 Dec 11;9(1):18829. doi: 10.1038/s41598-019-55100-2. Sci Rep. 2019. PMID: 31827152 Free PMC article.
References
-
- Pantaleo G, Menzo S, Vaccarezza M, Graziosi C, Cohen OJ, et al. (1995) Studies in subjects with long-term nonprogressive human immunodeficiency virus infection. N Engl J Med 332: 209–216. - PubMed
-
- Grabar S, Selinger-Leneman H, Abgrall S, Pialoux G, Weiss L, et al. (2009) Prevalence and comparative characteristics of long-term nonprogressors and HIV controller patients in the French Hospital Database on HIV. AIDS 23: 1163–1169. - PubMed
-
- Okulicz JF, Marconi VC, Landrum ML, Wegner S, Weintrob A, et al. (2009) Clinical outcomes of elite controllers, viremic controllers, and long-term nonprogressors in the US Department of Defense HIV natural history study. J Infect Dis 200: 1714–1723. - PubMed
-
- Deeks SG, Walker BD (2007) Human immunodeficiency virus controllers: mechanisms of durable virus control in the absence of antiretroviral therapy. Immunity 27: 406–416. - PubMed
Publication types
MeSH terms
Substances
LinkOut - more resources
Full Text Sources
Other Literature Sources
Medical
Molecular Biology Databases
Miscellaneous
