. 2014 Sep 16:5:4800.
doi: 10.1038/ncomms5800.

Morphological and population genomic evidence that human faces have evolved to signal individual identity

Affiliations

Morphological and population genomic evidence that human faces have evolved to signal individual identity

Michael J Sheehan et al. Nat Commun. .

Abstract

Facial recognition plays a key role in human interactions, and there has been great interest in understanding the evolution of human abilities for individual recognition and tracking social relationships. Individual recognition requires sufficient cognitive abilities and phenotypic diversity within a population for discrimination to be possible. Despite the importance of facial recognition in humans, the evolution of facial identity has received little attention. Here we demonstrate that faces evolved to signal individual identity under negative frequency-dependent selection. Faces show elevated phenotypic variation and lower between-trait correlations compared with other traits. Regions surrounding face-associated single nucleotide polymorphisms show elevated diversity consistent with frequency-dependent selection. Genetic variation maintained by identity signalling tends to be shared across populations and, for some loci, predates the origin of Homo sapiens. Studies of human social evolution tend to emphasize cognitive adaptations, but we show that social evolution has shaped patterns of human phenotypic and genetic diversity as well.


Conflict of interest statement

Conflict of interest statement: The authors have no conflicts of interest.

Figures

Figure 1
Figure 1. Humans have much more individually distinctive faces than many animals
(A) Human populations show extensive variability in facial morphology that is used for individual recognition. Patterns of elevated variability are even maintained in more genetically homogeneous populations such as the Finnish, as demonstrated by the portraits of six male soldiers (B) In contrast to the variability present in human faces, many animals such as king penguins have much more uniform appearances. While king penguins are not known to visually recognize individuals, they do have highly distinctive vocalizations that are used for individual recognition. (Photo credits: SA-kuva, Finnish Armed Forces photograph; Wikimedia commons)
Figure 2
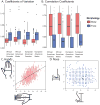
Figure 2. Morphological evidence that human faces have evolved to signal individual identity
Morphological comparisons of facial features to other aspects of body morphology are consistent with selection for identity signals. (A) In all four groups examined facial traits have higher coefficients of variation than other body traits (P < 0.03 for all comparison). (B) Facial traits as a group show lower inter-trait correlations than non-facial traits in all four populations examined (P < 0.001 for all comparisons). (C) For most traits, such as hands, larger individuals have larger traits such that the width and length of an individual's hand are correlated. (D) In contrast to hands, the width and length of the nose are not correlated. Box-plots show median and 25th and 75th percentiles (N = 181 African American females; 457 African American males; 204 European American females; 1168 European American males).The P-values shown The scatterplots show the trait values for European American male service members measured in the ANSUR II dataset. Best-fit lines are shown for significant regressions.
Figure 3
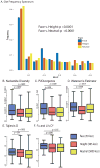
Figure 3. Population genomic evidence that human faces have evolved to signal individual identity
Genomic regions associated with facial morphology show evidence of selection for identity signaling in the Finnish. (A) Face regions (N=59) have elevated levels of intermediate-frequency alleles compared to neutral regions (N=5000) or genomic regions associated with variation in height (N=365). The bar graph shows the proportion of SNPs within each allele-frequency bin. (B) Additionally, face regions have elevated levels of π, (C) even after controlling for differing rates of divergence among loci. (D) Similarly, face regions show an elevated number of segregating sites, measured as Waterson's θ. (E) Tajima's D is higher in facial regions than neutral regions while (F) Fu and Li's D* is higher in facial regions than height regions. Box-plots show medians and 25th and 75th percentiles. Whiskers shows the 5th and 95th percentiles. Outliers are not shown so that the main distributions can be viewed at larger size. The P-values shown are from one-tailed Mann-Whitney U tests. Note that sample sizes are reduced for tests corrected for divergence, as alignments were not available for all regions considered (N= 58 face loci, 356 height loci, 4873 neutral loci).
Figure 4
Figure 4. Patterns of elevated diversity in face-associated loci across populations
The face-associated loci with elevated diversity consistent with selection for identity signaling tend to be shared across populations both within and between continents. The heatmap highlights loci on the extreme ends of the distributions for π (controlling for divergence with macaque) and Tajima's D. Columns correspond to populations and rows correspond to individual loci. Squares that are fully filled in with dark blue designate loci with evidence of elevated diversity (>95th percentile for both summary statistics). A greater number of loci show evidence of elevated diversity in at least one population for faces (9/58) compared to height (6/356; χ2 = 23.5, P < 0.0001) and intergenic regions (57/4873; χ2 = 78.8, P < 0.0001). Additionally, patterns of elevated diversity are more consistently shared across populations for face-associated regions compared to the neutral regions (5/9 face regions versus 1/57 neutral regions, χ2 = 27.2, P <0.0002). To facilitate visual comparison representative subsamples of height and intergenic regions are shown here. Subsamples were generated by randomly selecting loci from the height and neutral lists, which we confirmed did not deviate from the distribution of the total sample. All analyses reported were conducted on the full datasets.
Figure 5
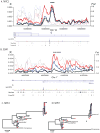
Figure 5. Evolutionary history of example face-associated loci
Patterns of genetic diversity associated with facial morphology at TMCT2 and SDK1. (A) At TMCT2 variation is largely shared across continents, while (B) at SDK1 variation has been lost mainly in the CHB population. The sliding window analyses (A – B) show nucleotide diversity for three 1000 Genomes populations representing Europe (FIN), Asia (CHB) and Africa (YRI) respectively for 5kb windows at 1kb sliding intervals. Nucleotide diversity is shown with solid lines while Fst is represented by dotted lines. Color of the lines represents the population examined for π (FIN = blue, CHB = black, YRI = red) or the two population Fst comparisons (FIN - YRI= red, CHB - YRI = black, FIN – CHB = blue) The locations of SNPs associated with facial morphology are shown as blue circles except for the focal SNP included in other window-based analyses that is denoted with a red circle. The UCSC Genome Browser tracks showing the locations of exons and three ENCODE regulatory regions, which show regions likely associated with genomic features involved in gene regulation, are shown below the sliding window. (C - D) Maximum-likelihood trees show the relationships among 10 modern humans sampled from each of three populations (FIN, CHB and YRI) as well as sequences from Denisovan, Neanderthal and Chimpanzee. The modern human sequences are colored according to their population of origin (FIN = blue, CHB = black, YRI = red). The region analyzed was the 5kb window with the highest nucleotide diversity as determined by the sliding window analysis. Note that in both cases, the sequences for archaic Hominins are nested within modern human diversity, indicating the origin of the major haplogroups predates the evolution of Homo sapiens.

References

    1. Dunbar RIM. Social cognition on the Internet: testing constraints on social network size. Philos Trans R Soc B Biol Sci. 2012;367:2192–2201. - PMC - PubMed
    1. Apicella CL, Marlowe FW, Fowler JH, Christakis NA. Social networks and cooperation in hunter-gatherers. Nature. 2012;481:497–501. - PMC - PubMed
    1. Dunbar RIM, Shultz S. Evolution in the social brain. Science. 2007;317:1344–1347. - PubMed
    1. Byrne RW, Whiten A. Machiavellian Intelligence: Social Expertise and the Evolution of Intellect in Monkeys, Apes, and Humans. Oxford: Univeristy Press; 1988.
    1. Whiten A, Erdal D. The human socio-cognitive niche and its evolutionary origins. Philos Trans R Soc B Biol Sci. 2012;367:2119–2129. - PMC - PubMed

Publication types