. 2014 Sep 16;9(9):e107363.
doi: 10.1371/journal.pone.0107363. eCollection 2014.

Bioluminescent imaging of genetically selected induced pluripotent stem cell-derived cardiomyocytes after transplantation into infarcted heart of syngeneic recipients

Affiliations

Bioluminescent imaging of genetically selected induced pluripotent stem cell-derived cardiomyocytes after transplantation into infarcted heart of syngeneic recipients

Vera Lepperhof et al. PLoS One. .

Abstract

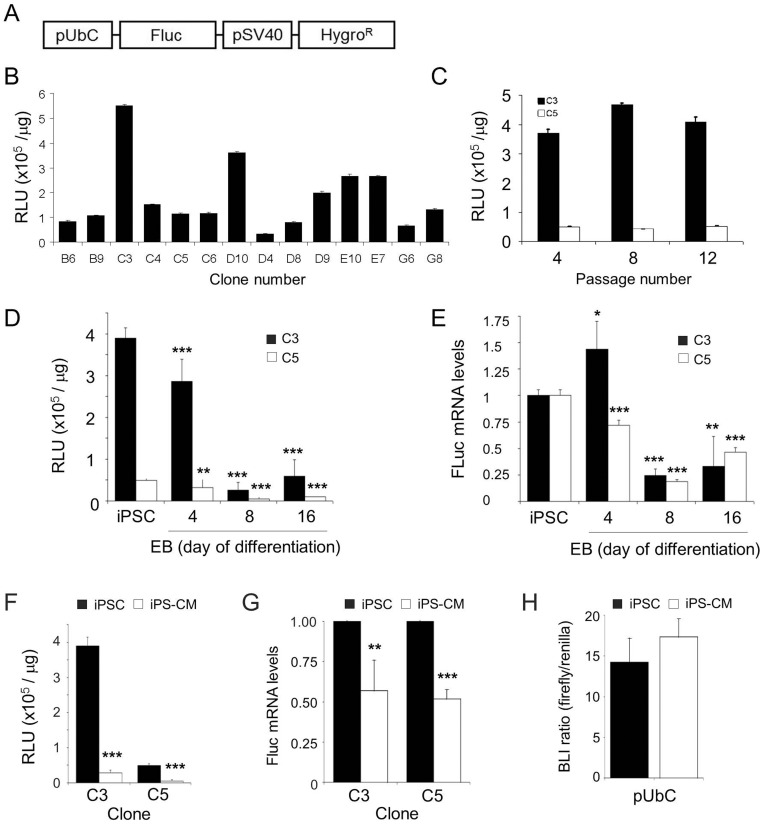
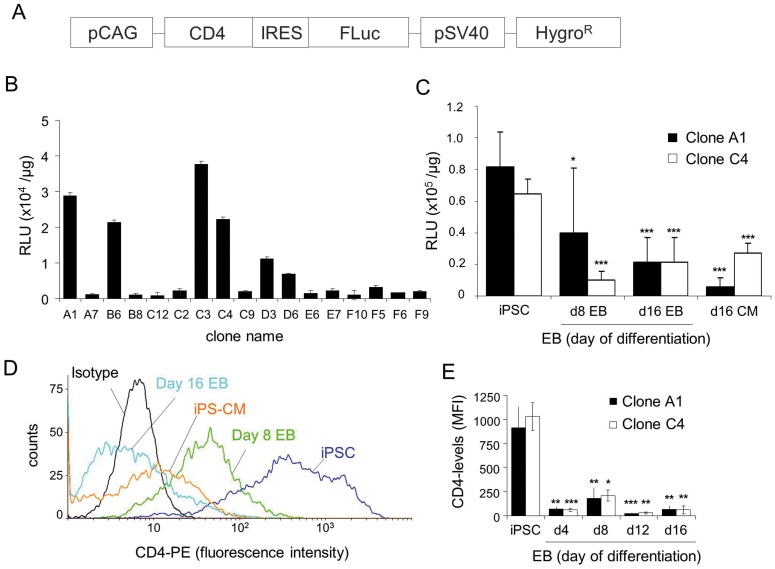
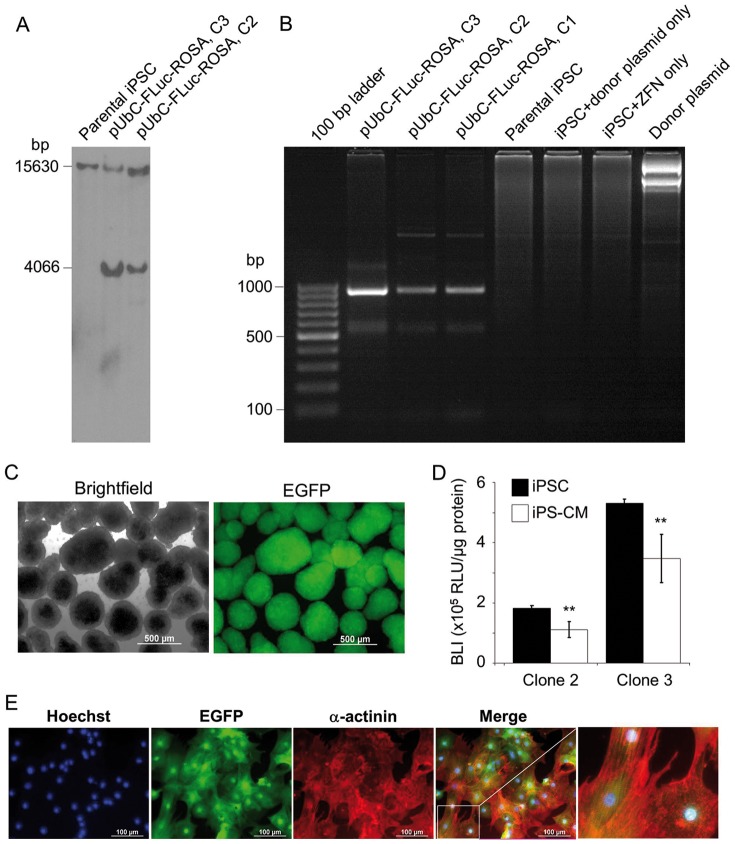
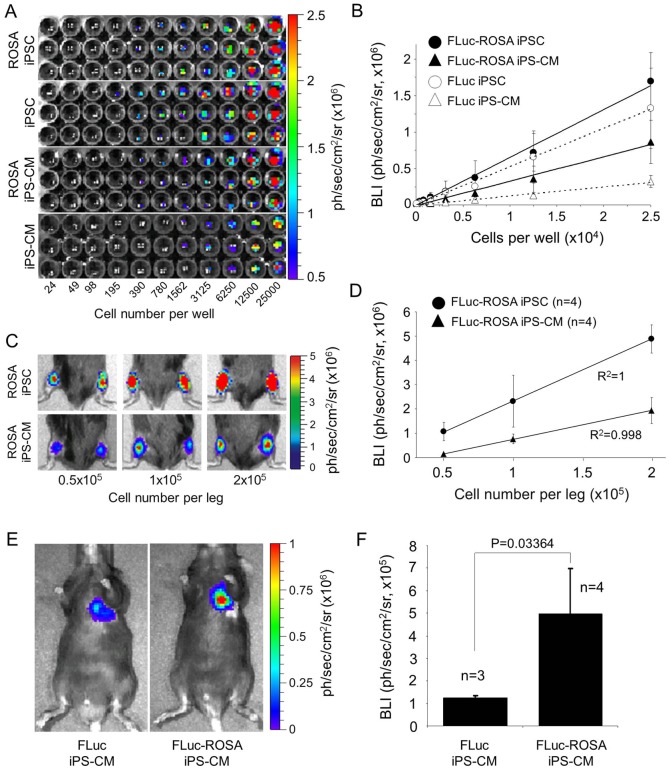
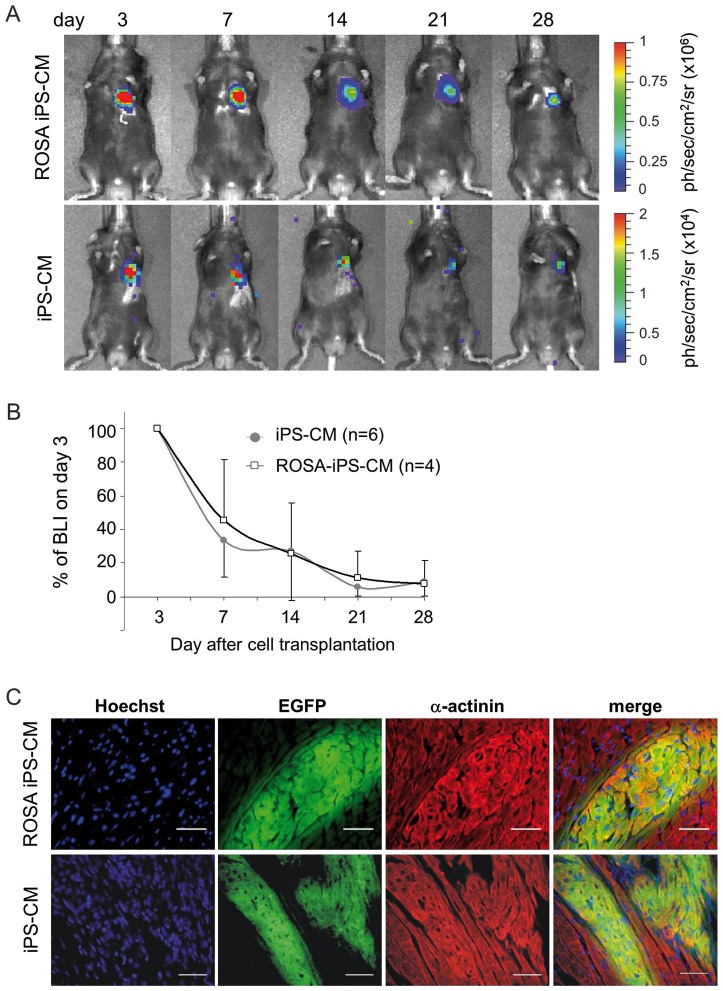
Cell loss after transplantation is a major limitation for cell replacement approaches in regenerative medicine. To assess the survival kinetics of induced pluripotent stem cell (iPSC)-derived cardiomyocytes (CM) we generated transgenic murine iPSC lines which, in addition to CM-specific expression of puromycin N-acetyl-transferase and enhanced green fluorescent protein (EGFP), also constitutively express firefly luciferase (FLuc) for bioluminescence (BL) in vivo imaging. While undifferentiated iPSC lines generated by random integration of the transgene into the genome retained stable FLuc activity over many passages, the BL signal intensity was strongly decreased in purified iPS-CM compared to undifferentiated iPSC. Targeted integration of FLuc-expression cassette into the ROSA26 genomic locus using zinc finger nuclease (ZFN) technology strongly reduced transgene silencing in iPS-CM, leading to a several-fold higher BL compared to iPS-CM expressing FLuc from random genomic loci. To investigate the survival kinetics of iPS-CM in vivo, purified CM obtained from iPSC lines expressing FLuc from a random or the ROSA26 locus were transplanted into cryoinfarcted hearts of syngeneic mice. Engraftment of viable cells was monitored by BL imaging over 4 weeks. Transplanted iPS-CM were poorly retained in the myocardium independently of the cell line used. However, up to 8% of cells survived for 28 days at the site of injection, which was confirmed by immunohistological detection of EGFP-positive iPS-CM in the host tissue. Transplantation of iPS-CM did not affect the scar formation or capillary density in the periinfarct region of host myocardium. This report is the first to determine the survival kinetics of drug-selected iPS-CM in the infarcted heart using BL imaging and demonstrates that transgene silencing in the course of iPSC differentiation can be greatly reduced by employing genome editing technology. FLuc-expressing iPS-CM generated in this study will enable further studies to reduce their loss, increase long-term survival and functional integration upon transplantation.


Conflict of interest statement

Competing Interests: The authors have declared that no competing interests exist.

Figures

Figure 1
Figure 1. Luciferase activity in stable FLuc-αPIG-iPS cells is clone dependent and decreases after spontaneous differentiation.
A. Scheme of the pGL4.14-pUbC [luc2/Hygro] plasmid used to generate stable iPSC lines constitutively expressing FLuc. B. BL signal intensity in protein lysates (5 µg/well) of 14 hygromycin-resistant pUbC-FLuc iPSC clones measured in triplicates using the BrightGlo Kit in a microplate reader. Data are shown as relative luminescence units (RLU) per µg of protein (n = 3). C. The stability of FLuc activity in transgenic pUbC-FLuc iPSC clones C3 and C5 over prolonged in vitro expansion (n = 3). D. BL signal intensity in protein lysates of pUbC-FLuc EB collected at different days during spontaneous differentiation as determined in microplate reader (n = 6 for C3, n = 9 for C5). E. Relative levels of FLuc transcript expression during spontaneous differentiation of pUbC-FLuc iPSC as determined by RT-qPCR (n = 6 from two independent differentiations). F. BL signal intensity in two clones (C3 and C5) of undifferentiated pUbC-FLuc iPSC and puromycin purified pUbC-FLuc iPS-CM on day 16 of differentiation. Data are given as mean ± SD of 2 independent experiments for clone C3 and 3 for clone C5, each measured in technical triplicates. G. Relative FLuc-transcript expression in two clones of purified pUbC-FLuc iPS-CM relative to undifferentiated pUbC-FLuc iPSC as determined by RT-qPCR. Data are shown as mean ± SD of 2 independent experiments measured in technical triplicates. H. UbC promoter activity in native iPSC and purified native iPS-CM measured 24 hours after transient transfection with pGL4.14-pUbC [luc2/Hygro] plasmid and renilla luciferase-encoding control plasmid. Values shown are ratios of FLuc activity relative to co-transfected renilla lucifderase activity given as mean ± SD (n = 3), p>0.05. Statistical analyses were performed by two-tailed paired Student's t-test: *p<0.05; **p<0.01; ***p<0.001.
Figure 2
Figure 2. Luciferase activity and CD4 coreceptor expression in stable pCAG-CD4/FLuc iPSC clones decrease during differentiation in vitro.
A. Schematic representation of the plasmid used to generate transgenic cell line expressing FLuc and extracellular domain of CD4 receptor under the control of CAG-promoter. B. FLuc-activity in 17 pCAG-CD4/FLuc αPIG-iPSC clones after hygromycin selection. BL was measured in iPSC lysates in a luminescence plate reader (n = 3). Values are given as mean relative luminescent units (RLU) ± SD per µg protein. C. FLuc-activity of the two pCAG-CD4/FLuc αPIG-iPSC clones was measured in cell lysates before and after spontaneous in vitro differentiation and selection of cardiomyocytes (d16 CM). Values are given as mean RLU ± SD per µg protein (n = 3). *p<0.05; ***p<0.001. D. Flow cytometric analysis of CD4 expression on the surface of pCAG-CD4/FLuc iPSC clone C4 in pluripotent state, day 8 EB, day 16 EB and puromycin selected CM at day 16 of differentiation. E. Quantification of CD4 expression levels in pCAG-CD4/FLuc iPSC clones A1 and C4 at different stages of differentiation. Values are given as mean fluorescent intensity (MFI) ± SD of triplicate measurements. *p<0.05; **p<0.01, ***p<0.001, compared to MFI of CD4 expression in iPSC.
Figure 3
Figure 3. Generation of pUbC-FLuc-ROSA αPIG-iPSC.
A. Genomic DNA was isolated from indicated cell lines, digested with EcoRI and hybridized with a probe for ROSA26 locus in a Southern blot analysis. Expected size of the wild type allele is 15630 bp and of successfully targeted allele 4066 bp because the integration of FLuc cassette results in an additional EcoRI restriction site. Presence of both bands in transgenic clones indicates heterozygous integration. B. PCR amplification of genomic DNA isolated from indicated cell lines and donor plasmid to verify the site specific integration of FLuc-expression cassette into the ROSA26 locus with an expected PCR product size of 950 kb. C. Representative brightfield and fluorescent images of puromycin-purified day 16 pUbC-FLuc-ROSA αPIG-iPSC-derived EGFP positive cardiac clusters. Scale bar  = 500 µm. D. Relative luminescence units (RLU) per µg protein in the two clones (C3 and C5) of undifferentiated pUbC-FLuc-ROSA αPIG-iPSC and CM derived from them on day 16 of differentiation. Values are from triplicate measurements of three independent differentiations. Statistics: two-tailed paired Student's t-test. **p<0.01. E. CM derived from pUbC-FLuc-ROSA αPIG-iPSC on day 16 of differentiation express EGFP (green) and cardiac structural protein α-actinin (red). Nuclei are stained with Hoechst 33342 (blue). Scale bar: 100 µm.
Figure 4
Figure 4. BL signal intensity of FLuc-iPSC and FLuc-iPS-CM depends on the cell dose, genomic locus of transgene integration and site of transplantation.
A. Optical signal intensity of serial dilutions of 2.5×10⁴ undifferentiated iPSC and purified iPS-CM expressing FLuc from random loci or ROSA26 locus were measured in IVIS. Images are representative results of one serial dilution in triplicate for each cell type. B. Demonstration of linearity between cell dose and BL intensity (BLI) of cells shown in panel A. The data are given as mean ± SD of BLI for each cell dose in photons/second/cm2/steridian. R2 values: FLuc-ROSA-iPSC: 0.9942; FLuc-ROSA-iPS-CM: 0.9876; FLuc-iPSC: 0.9962; FLuc-iPS-CM: 0.9913. C,D. Linear relationship between BL signal intensity and cell dose after transplantation of indicated numbers of pUbC-FLuc-ROSA-iPSC and their purified CM into the mouse hind limb muscle. Representative BL images of transplanted mice are shown in panel C and quantitative analysis of these data is shown in panel D as mean ± SD (n = 4) of BLI. E. Representative BL images of mice that received intramyocardial injections of 5×10⁵ pUbC-FLuc-iPS-CM or pUbC-FLuc-ROSA-iPS-CM. BL imaging was performed 6 hours after cell injection. F. Quantitative analysis of BLI in this experiment is given as mean ± SD for the indicated number of mice. Statistical analysis: two-tailed paired Student's t-test.
Figure 5
Figure 5. BL imaging of iPS-CM survival over 28 days after transplantation into the cryoinjured heart.
A. Representative images of mice injected with 5×10⁵ purified pUbC-Fluc-iPS-CM or pUbC-FLuc-ROSA-iPS-CM into the cryoinjured heart. BL measurements were performed on day 3, 7, 14, 21 and 28 after cell injection. B. Quantitative analysis of BL signal intensity (BLI) given as mean ± SD of percentages of values relative to BLI on day 3 after cell transplantation. C. After four weeks, the experiments were terminated and heart tissue analyzed by immunohistochemistry for the presence of EGFP-positive (green) and α-actinin-positive (red) FLuc-iPS-CM. Transplanted cells were found only in healthy myocardium adjacent to infarct area. Nuclei were counterstained with Hoechst 33342 (blue). Scale bars: 50 µm.

References

    1. Roger VL, Go AS, Lloyd-Jones DM, Benjamin EJ, Berry JD, et al. (2012) Heart disease and stroke statistics–2012 update: a report from the American Heart Association. Circulation 125: e2–e220. - PMC - PubMed
    1. Burt RK, Chen YH, Verda L, Lucena C, Navale S, et al. (2012) Mitotically inactivated embryonic stem cells can be used as an in vivo feeder layer to nurse damaged myocardium after acute myocardial infarction: a preclinical study. Circ Res 111: 1286–1296. - PubMed
    1. Singla DK, Lyons GE, Kamp TJ (2007) Transplanted embryonic stem cells following mouse myocardial infarction inhibit apoptosis and cardiac remodeling. Am J Physiol Heart Circ Physiol 293: H1308–1314. - PubMed
    1. Nelson TJ, Martinez-Fernandez A, Yamada S, Perez-Terzic C, Ikeda Y, et al. (2009) Repair of acute myocardial infarction by human stemness factors induced pluripotent stem cells. Circulation 120: 408–416. - PMC - PubMed
    1. Yan B, Abdelli LS, Singla DK (2011) Transplanted induced pluripotent stem cells improve cardiac function and induce neovascularization in the infarcted hearts of db/db mice. Mol Pharm 8: 1602–1610. - PubMed

Publication types

MeSH terms

Substances