. 2014 Sep 16;7(343):ra89.
doi: 10.1126/scisignal.2005392.

The autoinhibitory C-terminal SH2 domain of phospholipase C-γ2 stabilizes B cell receptor signalosome assembly

Affiliations

The autoinhibitory C-terminal SH2 domain of phospholipase C-γ2 stabilizes B cell receptor signalosome assembly

Jing Wang et al. Sci Signal. .

Abstract

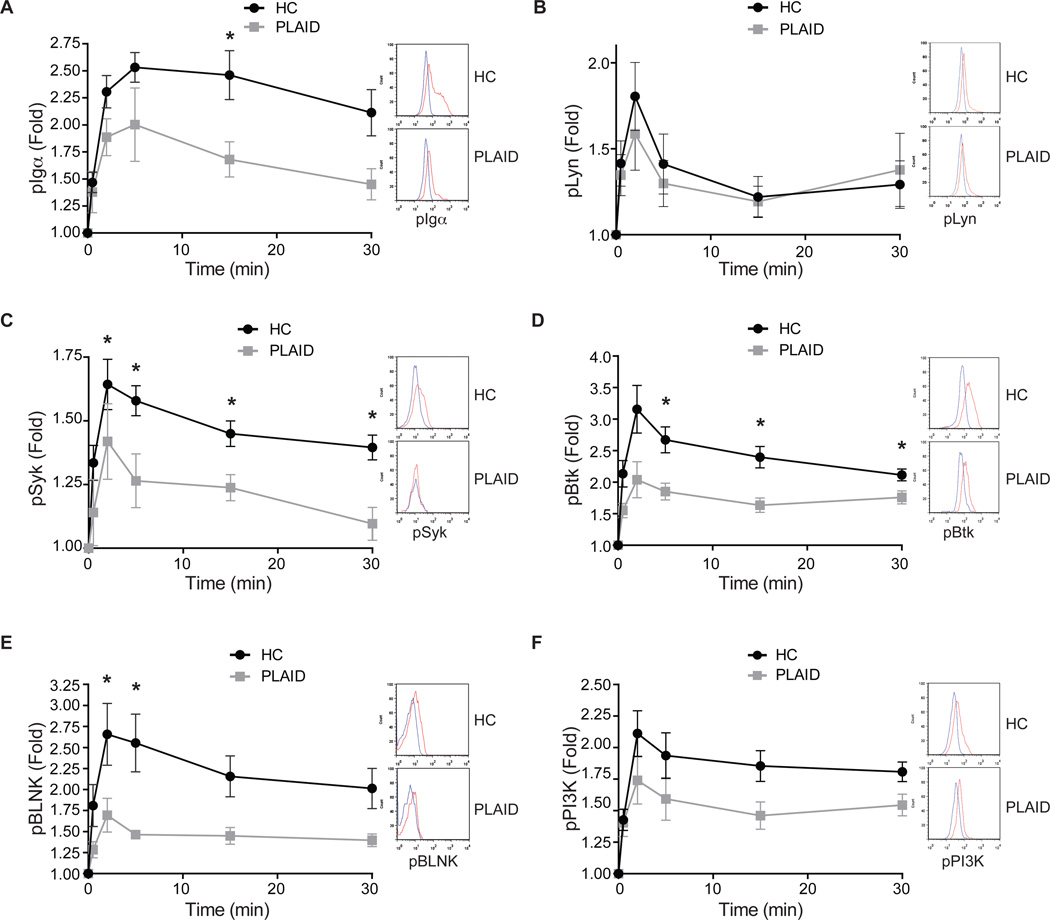
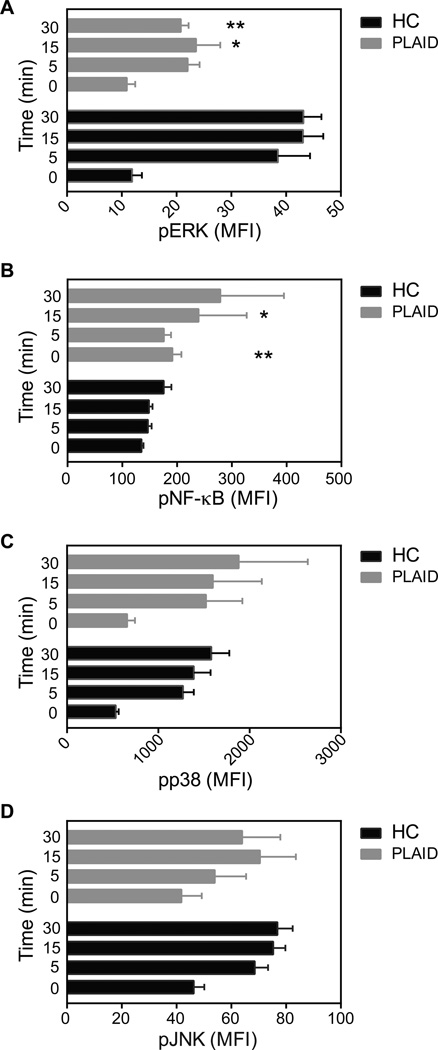
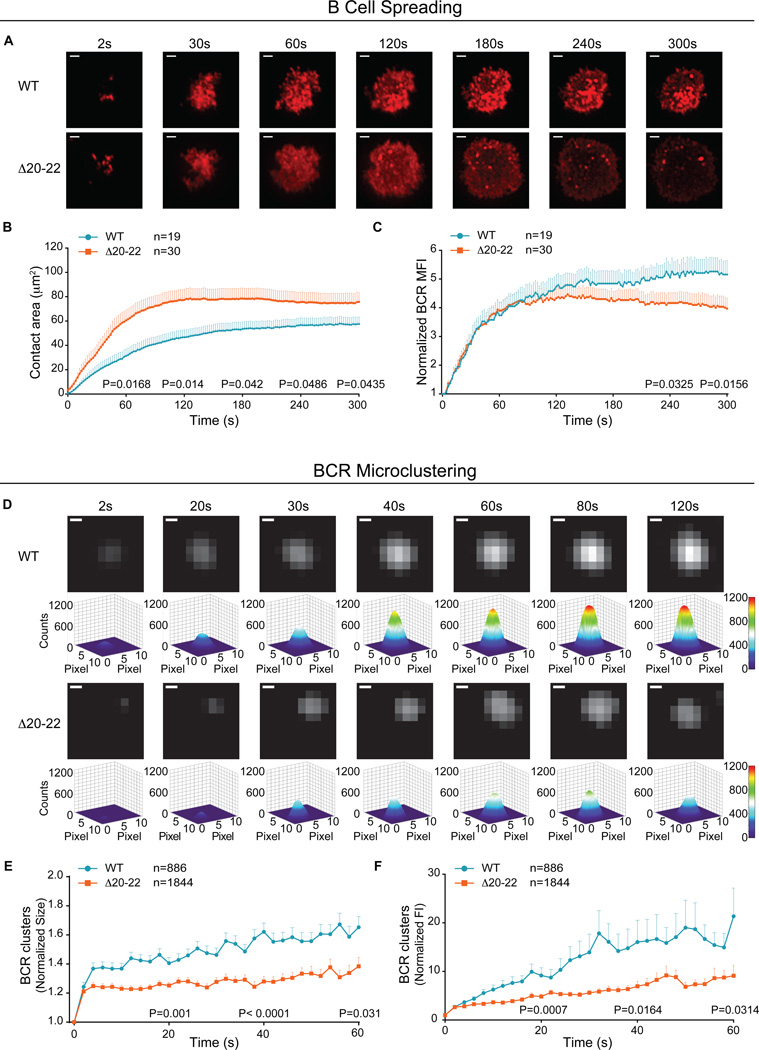
The binding of antigen to the B cell receptor (BCR) stimulates the assembly of a signaling complex (signalosome) composed initially of the kinases Lyn, spleen tyrosine kinase (Syk), and Bruton's tyrosine kinase (Btk), as well as the adaptor protein B cell linker (BLNK). Together, these proteins recruit and activate phospholipase C-γ2 (PLC-γ2), a critical effector that stimulates increases in intracellular Ca(2+) and activates various signaling pathways downstream of the BCR. Individuals with one copy of a mutant PLCG2 gene, which encodes a variant PLC-γ2 that lacks the autoinhibitory C-terminal Src homology 2 (cSH2) domain, exhibit PLC-γ2-associated antibody deficiency and immune dysregulation (PLAID). Paradoxically, although COS-7 cells expressing the variant PLC-γ2 show enhanced basal and stimulated PLC-γ2 activity, B cells from PLAID patients show defective intracellular Ca(2+) responses upon cross-linking of the BCR. We found that the cSH2 domain of PLC-γ2 played a critical role in stabilizing the early signaling complex that is stimulated by BCR cross-linking. In the presence of the variant PLC-γ2, Syk, Btk, and BLNK were only weakly phosphorylated and failed to stably associate with the BCR. Thus, BCRs could not form stable clusters, resulting in dysregulation of downstream signaling and trafficking of the BCR. Thus, the cSH2 domain functions not only to inhibit the active site of PLC-γ2 but also to directly or indirectly stabilize the early BCR signaling complex.


Figures

Fig. 1
Fig. 1. Altered early BCR signaling after BCR crosslinking in PLAID B cells
(A to F) PBMCs from either healthy control (HC) donors (n = 8 for pSyk; n = 12 for pPI3K; n = 9 for pBtk, pIgα, and pBLNK; and n = 5 for pLyn) or PLAID patients (n = 4 for pSyk; n = 5 for pPI3K; n = 4 for pBtk, pIgα, and pBLNK; and n = 3 for pLyn) were stimulated with F(ab')2 goat antibodies specific for human IgM (anti-IgM, 10 µg/ml) at 37°C. At the indicated times, cells were fixed on ice, permeabilized, and incubated with antibodies specific for (A) pIgα (Tyr182), (B) pLyn (Tyr396), (C) pSyk (Tyr352), (D) pBtk (Tyr223), (E) pBLNK (Tyr84), or (F) pPI3K p85 (Tyr458), as well as with FITC-labeled F(ab')2 goat antibodies specific for human IgD to enable gating on naïve B cells. Three-color flow cytometric analyses were performed. Graphs shown means ± SEM for fold-increases in the MFI for each phosphorylated protein at the indicated times relative to that of cells at time 0. *P < 0.05 by student’s t test. Representative flow cytometry plots for unstimulated cells (blue line) and for cells stimulated for 5 min with anti-IgM (red line) are shown to the right of each graph.
Fig. 2
Fig. 2. Altered intermediate kinase signaling upon BCR crosslinking in PLAID B cells
(A to D) PBMCs from HC donors (n = 3 for pERK; n = 8 for pJNK and pNF-ΚB; and n = 9 for pp38) or PLAID patients (n = 3 for pERK; n = 2 for pJNK and pNF-ΚB; and n = 3 for pp38) were analyzed by flow cytometry as described in Fig. 1 for the phosphorylation of (A) ERK, (B) NF-κB, (C) p38 and (D) JNK. Cells were treated with F(ab')2 anti-IgM (10 µg/µl) at 37°C for the indicated times, fixed, permeabilized on ice, and incubated with the appropriate phospho-specific antibodies, as well as with FITC-F(ab')2 anti-IgD to enable gating on naïve B cells. The MFIs of the phosphorylated proteins at the indicated times for IgD+ naïve B cells were obtained. Data are means ± SEM of the MFI. *P < 0.05, **P < 0.01, as determined by the student’s t test.
Fig. 3
Fig. 3. The effect of the PLAID Δ20–22 variant PLC-γ2 on the internalization and intracellular trafficking of the BCR
(A) B cells from PLAID patients (n = 3) and HC donors (n = 6) were incubated with biotinylated mouse monoclonal antibody specific for human IgM (10 µg/ml) on ice for 30 min, washed to remove unbound antibody, and incubated at 37°C for the indicated times. Cells were put on ice and incubated with Alexa Fluor 647–labeled streptavidin to quantify the cell surface abundance of the BCR, as well as with FITC-F(ab)'2 anti-IgD to identify naïve B cells. Data are means ± SEM of the percentage of the BCR that was internalized. (B to E) B cells from three HC donors and one PLAID patient were incubated with Alexa Fluor 549–labeled F(ab)'2 anti-IgM on ice for 30 min to crosslink the BCR, washed, and warmed to 37°C for the indicated times. Cells were permeabilized, stained with the nuclear stain DAPI, as well as with mouse monoclonal antibodies specific for either TfR or LAMP1, which were detected with Alexa Fluor 647–labeled antibodies against mouse IgG. Cells were then fixed and imaged by confocal microscopy. Shown are the reconstituted 3D surface images from a single HC donor and the PLAID patient of BCR (green), TfR (red), colocalization voxels (yellow), and merged images of the three targets with DAPI (blue) from Z stack confocal images taken at (B) 7 min and (D) 30 min after warming to 37°C. Pearson’s colocalization coefficients (R) were calculated for all three HCs and the PLAID patient for the 3D images at (C) 7 min and (E) 30 min after warming to 37°C. The 3D surface images were reconstituted and the Pearson’s colocalization coefficient (R) per cell was calculated. Graphs show means ± SEM for B cells from HC1 (n = 64 cells), HC2 (n = 30 cells), HC3 (n = 36 cells), and the PLAID patient (n = 49 cells) for the time point represented in (B), as well as from HC1 (n = 56 cells), HC2 (n =67 cells), HC3 (n =74 cells), and the PLAID patient (n = 69 cells) for the time point represented in (D), and are from one of two repeated experiments. ****P < 0.001 by unpaired student’s t test. Scale bar: 2.5 µm.
Fig. 4
Fig. 4. The transient expression of Δ20–22 PLC-γ2 in B cells from healthy donors recapitulates the signaling defects of PLAID B cells
(A) B cells transiently transfected with plasmids encoding either WT PLC-γ2-GFP (WT) or Δ20–22 PLC-γ2-GFP (Δ20–22) were analyzed by flow cytometry to determine the cell surface abundance of the IgM BCR. Data rea representative of three independent experiments. (B) B cells expressing either WT PLC-γ2-GFP or Δ20–22 PLC-γ2-GFP were stimulated with anti-IgM for the indicated times, and then the MFIs of pSyk (top), pBLNK (middle), and pBtk (bottom) in GFP+ and IgM+ B cells were determined by flow cytometric analysis. Graphs show Box and Whiskers plots with the median, as well as the minimum and maximum, for the fold-increase in the MFI of the indicated phosphorylated proteins at the indicated times relative to the MFI of cells expressing WT PLC-γ2-GFP at time zero. Data are from five independent experiments for pSyk and pBtk, and three independent experiments for pBLNK. *P < 0.05. (C) B cells expressing either WT PLC-γ2-GFP (n = 9) or Δ20–22 PLC-γ2-GFP (n = 4) were labeled with Fluo4, and Ca2+ flux in the cells was monitored by epifluorescence microscopy over time in response to incubation on anti-IgM–coated bilayers. Data are the average of the results of three independent experiments.
Fig. 5
Fig. 5. The effect of the Δ20–22 PLC-γ2 variant on BCR clustering and B cell spreading
(A) Human peripheral B cells transiently transfected with plasmids expressing either WT PLC-γ2-GFP (top) or Δ20–22 PLC-γ2-GFP (bottom) were labeled with DyLight 649-conjugated Fab anti-IgM, placed on anti-IgM bilayers (movie S1), and imaged by TIRF microscopy. Representative time-lapse images are shown. Scale bar: 2 µm. (B and C) Quantification of (B) the size of the contact area of the indicated B cells with the lipid bilayers and (C) the normalized MFI of the BCR within the contact area over time was performed for from 19 to 30 human B cells of each type obtained from three independent experiments. (D) Transfected B cells expressing either WT PLC-γ2-GFP or Δ20–22 PLC-γ2-GFP were labeled with DyLight 649-conjugated Fab anti-IgM antibody and analyzed by TIRF microscopy. Time-lapse TIRF images (see movie S2) and pseudocolored 3D surface plot images of representative BCR microclusters are shown. Individual BCR microclusters at each time point were fitted by 2D Gaussian fitter, and a 3D surface plot for each image was obtained with the ImageJ 3D surface plot plugins program. For each image, the display range is set from 0 to 1200 to enable direct comparisons to be made. Scale bar: 0.2 µm. (E and F) Quantification of (E) the sizes and (F) the normalized fluorescence intensity (FI) of all of the BCR microclusters analyzed as shown in (D) was performed. Data are means ± SEM of BCR clusters in B cells expressing either WT PLC-γ2 (n = 886 cells) or Δ20–22 PLC-γ2 (n =1844 cells) from the same images taken in (A). At the indicated times, two tailed student’s t tests were performed for statistical comparisons, and P values are indicated in the plots.
Fig. 6
Fig. 6. The Δ20–22 PLC-γ2 variant is recruited to the plasma membrane after BCR crosslinking, but only transiently colocalizes with BCR clusters
(A to D) Human B cells transiently transfected with plasmids expressing either WT PLC-γ2-GFP or Δ20–22 PLC-γ2-GFP were placed on anti-IgM bilayers and analyzed by two-color, time-lapse TIRF microscopy over 600 s. (A) Quantification of the MFI of the PLC-γ2-GFP in the contact areas of the indicated cells over time. (B) Representative two-color, time-lapse, live-cell TIRF images (see movie S3) of B cells expressing either WT PLC-γ2-GFP (left) or Δ20–22 PLC-γ2-GFP (right). Images shown are of the BCR (red), PLC-γ2-GFP (green), and merged images. Scale bar: 2µm. (C) Pearson’s colocalization coefficients between BCR and PLC-γ2 in the B cells imaged in (B) were determined as described earlier. (D) Colocalization between BCR and PLC-γ2 in cells fixed 15 min after cells were placed on anti-IgM bilayers. Data in C and D are means ± SEM from three independent experiments. Two tailed student’s t test or ANOVA were performed for statistical analysis and P values are indicated in the graphs.
Fig. 7
Fig. 7. The phosphorylation and colocalization of early signaling-related kinases with the BCR
(A to D) Human B cells transiently transected with plasmids expressing either WT PLC-γ2-GFP or Δ20–22 PLC-γ2-GFP were labeled with DyLight 649-Fab anti-IgM, placed on anti-IgM bilayers for 5 or 15 min, fixed, permeabilized, and stained with antibodies specific for (A) pLyn, (B) pSyk, (C) pBtk, or (D) pPI3K, and then were imaged by TIRF microscopy. Left: The MFIs of (A) pLyn, (B) pSyk, (C) pBtk, and (D) pPI3K. Right: The Pearson’s colocalization coefficients (R) between the BCR and (A) pLyn, (B) pSyk, (C) pBtk, and (D) pPI3K were determined as described earlier. Each data point represents the value obtained from an individual cell analyzed in a single independent experiment. Data are means ± SEM from three independent experiments. P values were calculated by ANOVA analysis.
Fig. 8
Fig. 8. BCR signaling defects in HC donor B cells expressing the Δ19 PLC-γ2 variant are similar to those in HC donor B cells expressing the Δ20–22 PLC-γ2 variant
(A) B cells transfected with plasmids expressing either WT PLCγ2-GFP or Δ19 PLCγ2-GFP were analyzed by flow cytometry to determine the cell surface abundance of the BCR. Flow cytometry profiles are representative of three independent experiments. (B) B cells transfected with plasmid expressing either WT PLCγ2-GFP or Δ19 PLCγ2-GFP were incubated on anti-IgM–coated bilayers, and Ca2+ flux in the cells was monitored as described earlier. Data are means ± SEM from 10 (WT) and 14 (Δ19) cells. (C to F) B cells transfected with plasmids expressing either WT PLC-γ2-GFP or Δ19 PLC-γ2-GFP were placed on anti-IgM bilayers and analyzed by time-lapse, live-cell TIRF microscopy. (C) Quantification of the MFI of the PLC-γ2-GFP in the contact area of the indicated B cells over time. Data are means ± SEM from 18 (WT) and 16 (Δ19) cells. (D) Pearson’s colocalization coefficients between BCR and PLC-γ2 in the indicated cells over time were determined. Data are means ± SEM from 18 (WT) and 19 (Δ19) cells. Each data point represents the value obtained from a single cell analyzed in one of three independent experiments. Statistical significance was determined by ANOVA. Quantification of (E) the size of the contact area and (F) the normalized MFI of the BCR within the contact area. Data are means ± SEM from 18 (WT) and 24 (Δ19) cells. Two tailed student’s t tests were performed for statistical comparisons, and P values are provided at the indicated times in the inset.
Fig. 9
Fig. 9. Spatial and temporal dysregulation of pCbl in B cells expressing the Δ20–22 variant PLC-γ2-GFP
(A and B) Human B cells transfected with plasmids expressing either WT PLC-γ2-GFP or Δ20–22 PLC-γ2-GFP were labeled with DyLight 649-Fab anti-IgM, placed on anti-IgM bilayers for 5 or 15 min, fixed, stained with antibody specific for pCbl (Tyr700), and imaged by TIRF microscopy. (A) Representative TIRF images for the BCR (red) and pCbl (green), as well as merged images are shown. (B) Left: Means ± SEM of the MFI of pCbl. Right: Pearson’s colocalization coefficients for the BCR and pCbl. Each data point represents the values from a cell analyzed in one of two independent experiments. Statistical analysis was performed by ANOVA.

References

    1. Kurosaki T, Hikida M. Tyrosine kinases and their substrates in B lymphocytes. Immunol Rev. 2009;228:132–148. - PubMed
    1. Kadamur G, Ross EM. Mammalian phospholipase C. Annual review of physiology. 2013;75:127–154. - PubMed
    1. Scharenberg AM, Humphries LA, Rawlings DJ. Calcium signalling and cell-fate choice in B cells. Nat Rev Immunol. 2007;7:778–789. - PMC - PubMed
    1. Hilgemann DW. Local PIP(2) signals: when, where, and how? Pflugers Archiv: European journal of physiology. 2007;455:55–67. - PubMed
    1. Saito K, Tolias KF, Saci A, Koon HB, Humphries LA, Scharenberg A, Rawlings DJ, Kinet JP, Carpenter CL. BTK regulates PtdIns-4,5-P2 synthesis: importance for calcium signaling and PI3K activity. Immunity. 2003;19:669–678. - PubMed

Publication types

MeSH terms

LinkOut - more resources