Comparative Study
. 2014;144(1):15-27.
doi: 10.1159/000366251. Epub 2014 Sep 11.

Comparison of chromosome breakage in non-mosaic and mosaic patients with Fanconi anemia, relatives, and patients with other inherited bone marrow failure syndromes

Affiliations
Comparative Study

Comparison of chromosome breakage in non-mosaic and mosaic patients with Fanconi anemia, relatives, and patients with other inherited bone marrow failure syndromes

John H Fargo et al. Cytogenet Genome Res. 2014.

Abstract

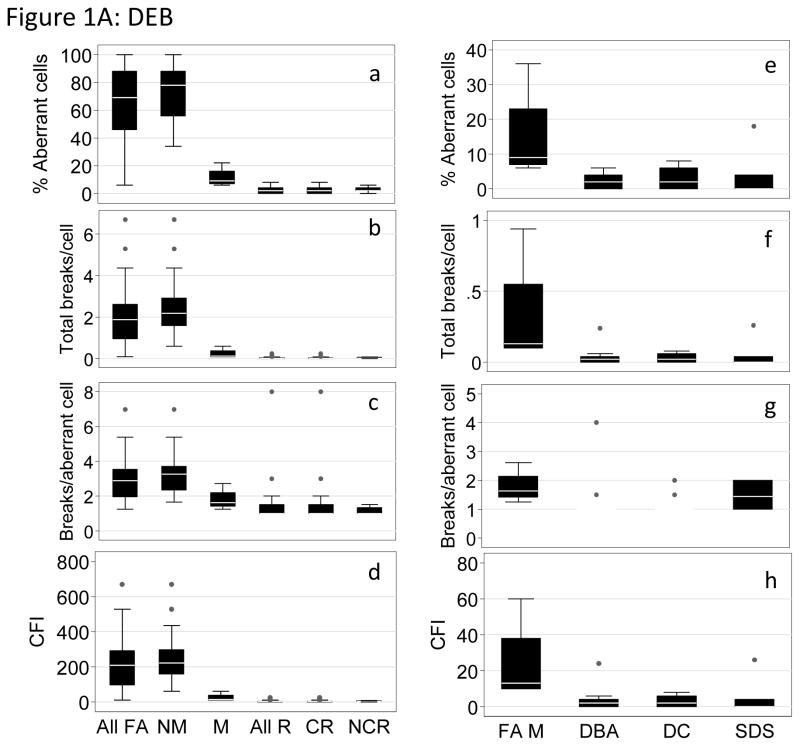
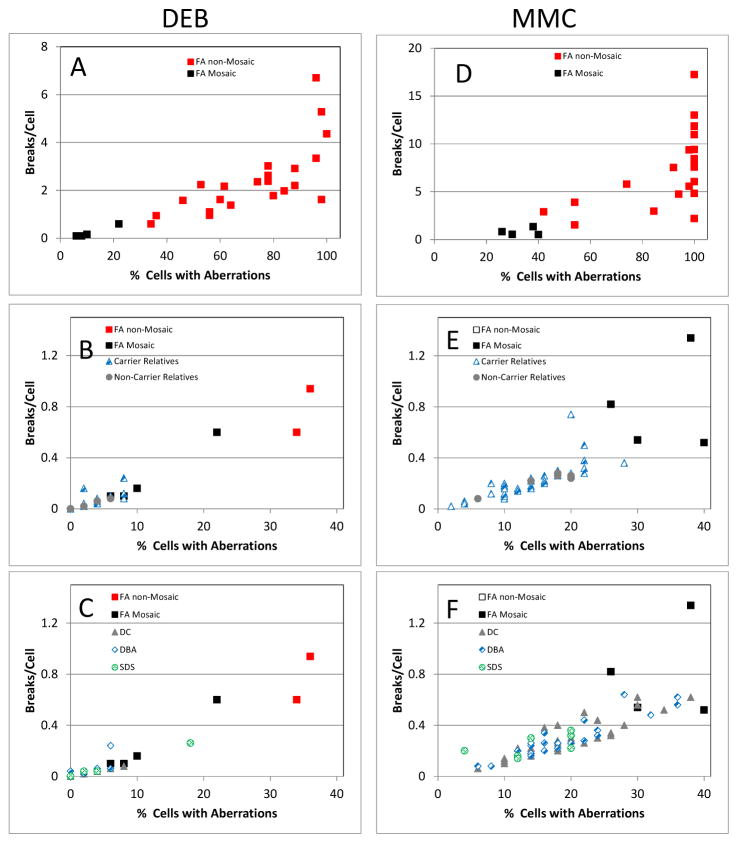
Fanconi anemia (FA) is a rare inherited bone marrow failure syndrome (IBMFS). Affected individuals must be distinguished from relatives, patients with mosaicism must be identified, and patients with other IBMFS classified as non-FA. The diagnostic feature of FA is increased chromosomal breakage in blood lymphocytes cultured with diepoxybutane or mitomycin C. Here, we sought a method to uniquely identify patients with FA with mosaicism, using cells from participants in the National Cancer Institute IBMFS cohort. Lymphocytes were treated with diepoxybutane or mitomycin C, and metaphases scored for breaks and radials. Analyses included the percentage of cells with any aberration, breaks per cell, and breaks per aberrant cell. There were 26 patients with FA (4 mosaics), 46 FA relatives, and 62 patients with a non-FA IBMFS. By all analytic methods, patients with FA were abnormal compared with other groups. Those with FA mosaicism had more breakage than relatives or patients with non-FA IBMFS, but there was some individual overlap. The choices of clastogen are laboratory-dependent, but there was no method or analysis of lymphocytes that clearly distinguished all individuals mosaic for FA from relatives or patients with other IBMFS. Thus, genotyping remains the best method for providing absolute clarity.


Figures

Fig. 1
Fig. 1
Comparison of chromosome breakage results among patients with FA, their relatives, and patients with other IBMFS. Data are shown as boxplots. A) Diepoxybutane (DEB). a) percent aberrant cells in patients with FA (All FA, N = 26), non-mosaic patients (NM, N = 22), mosaic patients (M, N = 4), relatives of patients with FA (All R, N = 46), carrier relatives (CR, N = 40), and non-carrier relatives (NCR, N = 6). b) total breaks per cell in the groups in (a). c) total breaks per aberrant cell in the groups in (a). d) chromosome fragility index (CFI) (percent aberrant cells x breaks per aberrant cell), in the groups in (a). Mosaic patients had significantly lower percent aberrant cells, breaks per cell, and CFI than non-mosaic patients (all p <0.01), and respectively higher than in relatives in the same analyses (all p <0.001). However, while the breaks per aberrant cell in the mosaic samples were lower than in the non-mosaics (p=0.04), the mosaics were in the same range as the relatives (p=0.6). Panels e–g compare patients with FA and mosaicism (FA M, N = 4) with patients with the other IBMFS: Diamond-Blackfan anemia (DBA, N = 24), dyskeratosis congenita (DC, N = 31), and Shwachman-Diamond syndrome (SDS, N = 7). In all analyses, the four mosaic patients with FA had a wider range of results. The percent aberrant cells, breaks per cell, and CFI in the mosaics were higher than in DBA and DC (p<0.001) but not than SDS (p = 0.1). The breaks per aberrant cells were similar in the mosaics to those in DBA. B) Mitomycin C (MMC), same groups as in 1A. The mosaic patient samples were lower than the non-mosaics in all categories, and higher than the relatives (panels e, f, g, h). The mosaic patients with FA were also higher than the other IBMFS (p<0.001), except the breaks per aberrant cell in SDS were within the range of the FA mosaics (p = 0.6).
Fig. 1
Fig. 1
Comparison of chromosome breakage results among patients with FA, their relatives, and patients with other IBMFS. Data are shown as boxplots. A) Diepoxybutane (DEB). a) percent aberrant cells in patients with FA (All FA, N = 26), non-mosaic patients (NM, N = 22), mosaic patients (M, N = 4), relatives of patients with FA (All R, N = 46), carrier relatives (CR, N = 40), and non-carrier relatives (NCR, N = 6). b) total breaks per cell in the groups in (a). c) total breaks per aberrant cell in the groups in (a). d) chromosome fragility index (CFI) (percent aberrant cells x breaks per aberrant cell), in the groups in (a). Mosaic patients had significantly lower percent aberrant cells, breaks per cell, and CFI than non-mosaic patients (all p <0.01), and respectively higher than in relatives in the same analyses (all p <0.001). However, while the breaks per aberrant cell in the mosaic samples were lower than in the non-mosaics (p=0.04), the mosaics were in the same range as the relatives (p=0.6). Panels e–g compare patients with FA and mosaicism (FA M, N = 4) with patients with the other IBMFS: Diamond-Blackfan anemia (DBA, N = 24), dyskeratosis congenita (DC, N = 31), and Shwachman-Diamond syndrome (SDS, N = 7). In all analyses, the four mosaic patients with FA had a wider range of results. The percent aberrant cells, breaks per cell, and CFI in the mosaics were higher than in DBA and DC (p<0.001) but not than SDS (p = 0.1). The breaks per aberrant cells were similar in the mosaics to those in DBA. B) Mitomycin C (MMC), same groups as in 1A. The mosaic patient samples were lower than the non-mosaics in all categories, and higher than the relatives (panels e, f, g, h). The mosaic patients with FA were also higher than the other IBMFS (p<0.001), except the breaks per aberrant cell in SDS were within the range of the FA mosaics (p = 0.6).
Fig. 2
Fig. 2
Percent cells with aberrations. Left, DEB. A) Comparison of patients with non-mosaic FA (white bars, red online) with mosaic FA (black bars). B) Comparison of patients with mosaic FA (black bars) with relatives of FA patients (stripes, blue online, FA gene carrier relatives; grey, non-carrier relatives. C) Comparison of patients with mosaic FA with patients with other inherited bone marrow failure syndromes (IBMFS). Black bars, FA mosaics. Grey bars, dyskeratosis congenita (DC). Striped bars, blue online, Diamond-Blackfan anemia (DBA). Stippled bars, green online, Shwachman-Diamond syndrome (SDS). Right, MMC. Groups in D–F are the same as in A–C. The patients with FA and mosaicism have lower percent cells with aberrations than patients with FA who do not have mosaicism. However, the mosaic patients with FA overlap with relatives of FA patients, and with patients with DBA and DC. See Table 2 for statistical analyses.
Fig. 3
Fig. 3
Breaks per cell. Left, DEB. A) Comparison of patients with non-mosaic FA with patients with mosaic FA. B) Comparison of patients with mosaic FA with carrier and non-carrier relatives. C) Comparison of patients with mosaic FA with patients with DC, DBA, and SDS. Right, MMC. D–F, groups as in A–C. Symbols as in Figure 2. There is slight overlap between the results in patients with FA with and without mosaicism, as well as relatives and other IBMFS.
Fig. 4
Fig. 4
Breaks per aberrant cell. Left, DEB. A) Comparison of patients with non-mosaic with mosaic FA. B) Comparison of patients with mosaic FA with relatives. C) Comparison of patients with mosaic FA with patients with other IBMFS. Right, MMC. D–F, groups as in A–C. Symbols as in Figure 2. There is overlap between the results in patients with FA with and without mosaicism, as well as relatives and other IBMFS.
Fig. 5
Fig. 5
Breaks per cell compared with percent aberrant cells. Left, DEB. A) Comparison of patients with non-mosaic with mosaic FA. B) Comparison of patients with mosaic FA with relatives. C) Comparison of patients with mosaic FA with patients with other IBMFS. Right, MMC. D–F, groups as in A–C. Symbols as in Figure 2. The patients with mosaic FA have lower values than the patients with non-mosaic FA, but overlap with relatives and other IBMFS.
Fig. 6
Fig. 6
Chromosome fragility index (CFI, percent aberrant cells x breaks per aberrant cell). Left, DEB. A) Comparison of patients with non-mosaic with those with mosaic FA. B) Comparison of patients with mosaic FA with relatives. C) Comparison of patients with mosaic FA with patients with other IBMFS. Right, MMC. D–F, groups as in A–C. Symbols as in Figure 2. One patient with FA with mosaicism has the same CFI as one without mosaicism, and the other three patients with mosaicism overlap with relatives and other IBMFS.

References

    1. Alter BP, Giri N, Savage SA, Peters JA, Loud JT, Leathwood L, Carr AG, Greene MH, Rosenberg PS. Malignancies and survival patterns in the National Cancer Institute inherited bone marrow failure syndromes cohort study. Br J Haematol. 2010;150:179–188. - PMC - PubMed
    1. Alter BP, Joenje H, Oostra AB, Pals G. Fanconi anemia: adult head and neck cancer and hematopoietic mosaicism. Arch Otolaryngol Head Neck Surg. 2005;131:635–639. - PubMed
    1. Alter BP, Rosenberg PS, Brody LC. Clinical and molecular features associated with biallelic mutations in FANCD1/BRCA2. J Med Genet. 2007;44:1–9. - PMC - PubMed
    1. Auerbach AD. Fanconi anemia and its diagnosis. Mutat Res. 2009 Jul 31;668:4–10. - PMC - PubMed
    1. Auerbach AD, Adler B, Chaganti RSK. Prenatal and postnatal diagnosis and carrier detection of Fanconi anemia by a cytogenetic method. Pediatrics. 1981;67:128–135. - PubMed

Publication types

MeSH terms

LinkOut - more resources