. 2015 Sep;74(3):706-15.
doi: 10.1002/mrm.25449. Epub 2014 Sep 16.

Balanced SSFP Dixon imaging with banding-artifact reduction at 3 Tesla

Affiliations

Balanced SSFP Dixon imaging with banding-artifact reduction at 3 Tesla

Brady Quist et al. Magn Reson Med. 2015 Sep.

Abstract

Purpose: To develop a three-dimensional (3D) balanced steady-state free-precession (bSSFP) two-point Dixon method with banding-artifact suppression to offer robust high-resolution 3D bright-fluid imaging.

Methods: A complex sum reconstruction that combines phase-cycled bSSFP images acquired at specific echo times for robust fat/water separation without banding was investigated and compared with a magnitude-based method. Bloch simulations using both single-peak and multiple-peak fat models were performed to predict the performance of these methods for a wide range of echo times and repetition times. The quality and degree of fat/water separation was evaluated in both simulations and using in vivo imaging.

Results: Simulations predicted that both effective banding-artifact suppression and substantial improvements in fat/water separation are possible at echo times that are different from conventional echo times, enabling improved spatial resolution. Comparisons between various echo times and repetition times in vivo validated the improved fat/water separation and effective banding-artifact removal predicted by the simulations.

Conclusion: The proposed complex sum Dixon 3D bSSFP method is able to effectively separate fat and water at different sets of echo times, while removing banding-artifacts, providing a fast, high-resolution, T2 -like sequence without blurring.

Keywords: SSFP; artifact reduction; bSSFP; fat suppression; fat water separation; steady-state.


Figures

FIG. 1
FIG. 1
The characteristic bSSFP signal vs. frequency pattern for T1/T2 = 1400/54 ms and TE/TR = 2.2/4.4 ms, are shown for both the 0° phase-cycling increment (a) and the 180° phase-cycling increment (b). Two common banding-artifact suppression techniques are performed by either taking the complex sum (c) or the root-sum-of-squares (d) of both phase-cycling schemes. Note that the complex sum combination approximates the unbalanced gradient echo sequence, while the root-sum-of-squares combination removes all phase information.
FIG. 2
FIG. 2
The bSSFP signals vs. frequency simulated using a TE1/TE2/TR of 1.1/2.2/4.4 ms, a flip angle of 35°, a 70% fat-fraction, and the water/multiple-peak fat models given in Supporting Table S1 are shown as they pass through the Complex Sum (CSUM) (a) and Root-Sum-of-Squares (RSOS) (b) reconstruction methods. Both methods start with bSSFP data from both 0° and 180° phase-cycling (PC) schemes and two separate TEs. The CSUM method first combines the individual phase-cycles by performing a complex sum to remove the banding. The remaining, band-free echoes are then processed using Ma’s 2-point Dixon technique to create one water and fat image. The RSOS method first creates a water/fat image for each phase-cycle. The water images and the fat images are then each combined using a root-sum-of-squares combination to create a band-free water and fat image.
FIG. 3
FIG. 3
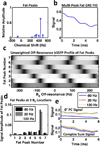
The spectral location and relative amplitudes of the fat peaks used in the multiple-peak fat model (a) and the GRE FID simulated by combining the weighted fat peaks (b). The unique shifting patterns of the unweighted bSSFP profiles of each fat peak are shown in c for a TR of 5.8 ms and a flip angle of 35°. Sampling and weighting each of the fat peaks at B0 off-resonance values of −80, 20, and 120 Hz leads to the magnitude profiles in d along with the weighted, combined 0° phase-cycling and complex sum bSSFP FIDs (e). The 0° phase-cycling FIDs clearly show variation in shape and amplitude at different B0 off-resonances that are significantly reduced in the complex sum FIDs.
FIG. 4
FIG. 4
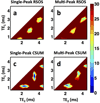
The worst-case percent error versus the first and second echo time of both the single-peak (a, c) and multiple-peak (b, d) fat models for both the RSOS (a, b) and CSUM (c, d) reconstruction methods. The error was simulated using a flip angle of 35° and a TR of 5.8 ms. The single-peak fat model predicts very good fat/water separation over a larger range of echo times than the multiple-peak fat model. Furthermore, we see that for this choice of TR and flip angle, the CSUM method has regions of lower estimated error than the RSOS method.
FIG. 5
FIG. 5
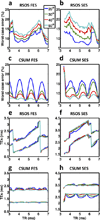
The minimum worst-case error (MWCE) of the First and Second Echo Sets (FES/SES) for the RSOS and CSUM methods using the multiple-peak fat model are shown in a–d for flip angles of 20°, 30°, 40°, and 50°. The optimal echo times that produce the MWCE for each model and flip angle are shown in e–h. For flip angles above 30 degrees, the CSUM method generally predicts a better MWCE than the RSOS method for regions of TRs that predict a low MWCE.
FIG. 6
FIG. 6
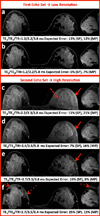
CSUM water images of the knee at various echo time combinations (a–d) are shown along with the corresponding CSUM fat image (e), RSOS fat and water images (f, g), and the magnitude image from one of the individual phase-cycles (h). The solid arrows point to regions where a banding null in the individual phase-cycle image not only creates noticeable banding in the CSUM fat image (e), but also leads to worse fat/water separation in the CSUM water images when compared to the surrounding tissue. Dashed arrows indicate regions where banding nulls have led to fat/water swaps in the RSOS fat/water images. The CSUM method was found to generally lead to better fat/water separation and also to be far more robust to fat/water swaps. Additionally, the multiple-peak (MP) fat model was clearly able to predict the optimal echo time combinations (a, d) that exhibit the best fat/water separation.
FIG. 7
FIG. 7
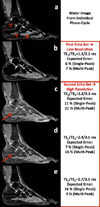
A water foot image from an individual phase-cycle (a) shows the severe banding (dashed arrows) that indicate significant B0 inhomogeneity. The corresponding CSUM water images (b–e), acquired at various echo times with a TR of 5.8 ms, show that the multiple-peak fat model is able to accurately predict echo pairs with improved fat/water separation (b, e). The solid arrows show bands of poor fat/water separation in the images for which the multiple-peak fat model predicts poor fat/water separation (c, d).
FIG. 8
FIG. 8
Axial (left) and Sagittal (right) CSUM water images of the breast at various echo times and repetition times, show that the multiple-peak (MP) fat model is able to more accurately predict TE/TR combinations with improved fat/water separation (a, b, e) than the single-peak (SP) fat model. As expected, the performance of the fat/water separation is dependent on B0 variations (off-resonance). The dashed arrow indicates a region where the poor fat/water separation would have easily mistaken fat for glandular tissue. The solid arrows indicate a region of poor fat/water separation that is noticeably reduced at the optimal TE/TR combinations. Dotted arrows point to regions of poor fat/water separation that were acquired at the optimal TE combination and a suboptimal TR (f). Not only do the locations of the poor fat/water separation change with TR, but the regions of poor fat/water separation are much more pronounced at the suboptimal TR.
FIG. 9
FIG. 9
High-resolution images of the breast acquired with optimized echo times at a resolution of 0.5×0.5×1.0 mm3. (This resolution would be impossible at 1.2/2.2 ms echo times, and images would be degraded with 2.2/3.3 ms echo times.) Two separate axial slices are displayed (above) along with the Maximum Intensity Projection (below). The boxed portions have been zoomed in and are shown on the right of each image. The high resolution of the images clearly contributes to the fine details seen in the vasculature and the fibroglandular tissue of the breast.

References

    1. Hennig J, Naureth A, Briedburg H. RARE imaging: a fast imaging method for clinical. Magn Reson Med. 1986;3:823–833. - PubMed
    1. Bredella MA, Tirman PF, Peterfy CG, Zarlingo M, Feller JF, Bost FW, Belzer JP, Wischer TK, Genant HK. Accuracy of T2-weighted fast spin-echo MR imaging with fat saturation in detecting cartilage defects in the knee: comparison with arthroscopy in 130 patients. AJR Am J Roentgenol. 1999;172:1073–1080. - PubMed
    1. Ma J, Singh SK, Kumar AJ, Leeds NE, Broemeling LD. Method for efficient fast spin echo Dixon imaging. Magn Reson Med. 2002;48:1021–1027. - PubMed
    1. Carr HY. Steady-state free precession in nuclear magnetic resonance. Phys Rev. 1958;112:1693–1701.
    1. Oppelt A, Graumann R, Barfuss H, Fischer H, Hartl W, Shajor W. FISP -- a new fast MRI sequence. Electromedica. 1986;54:15–18.

Publication types