

Drake's rule as a consequence of approaching channel capacity
- PMID: 25228346
- PMCID: PMC4209235
- DOI: 10.1007/s00114-014-1235-6
Drake's rule as a consequence of approaching channel capacity
Abstract
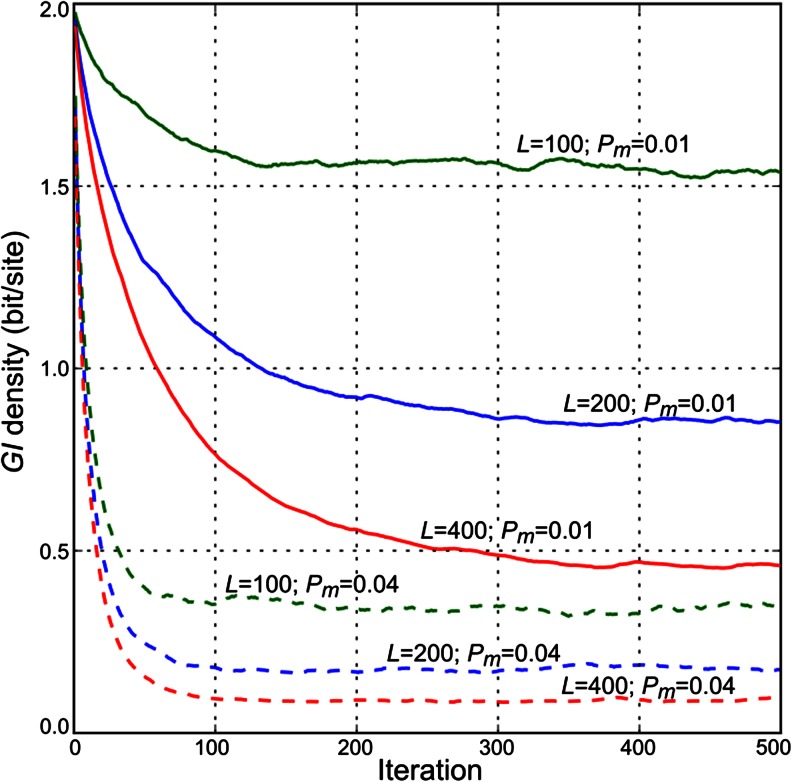
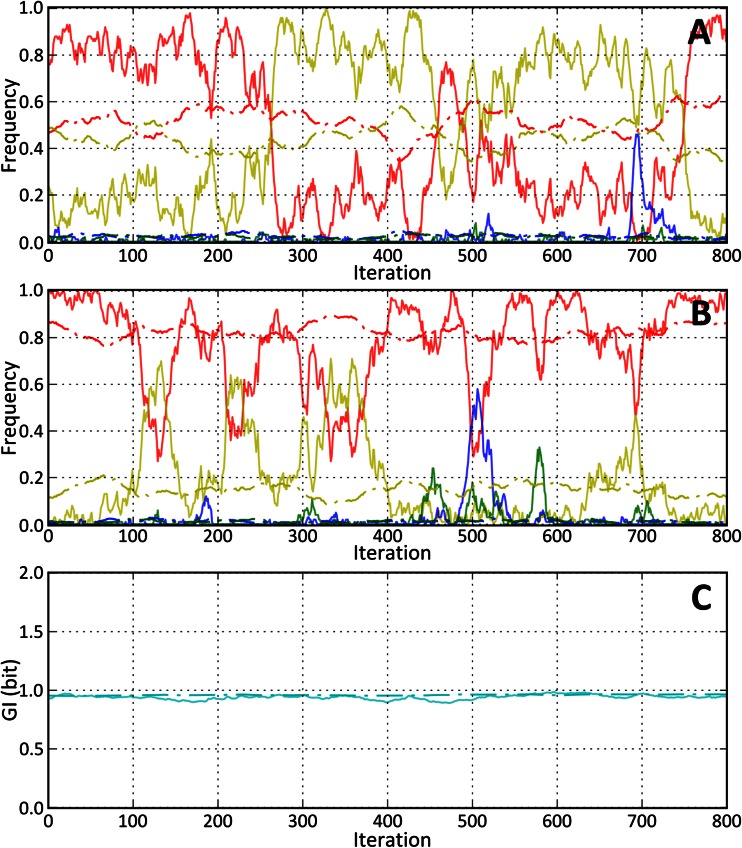
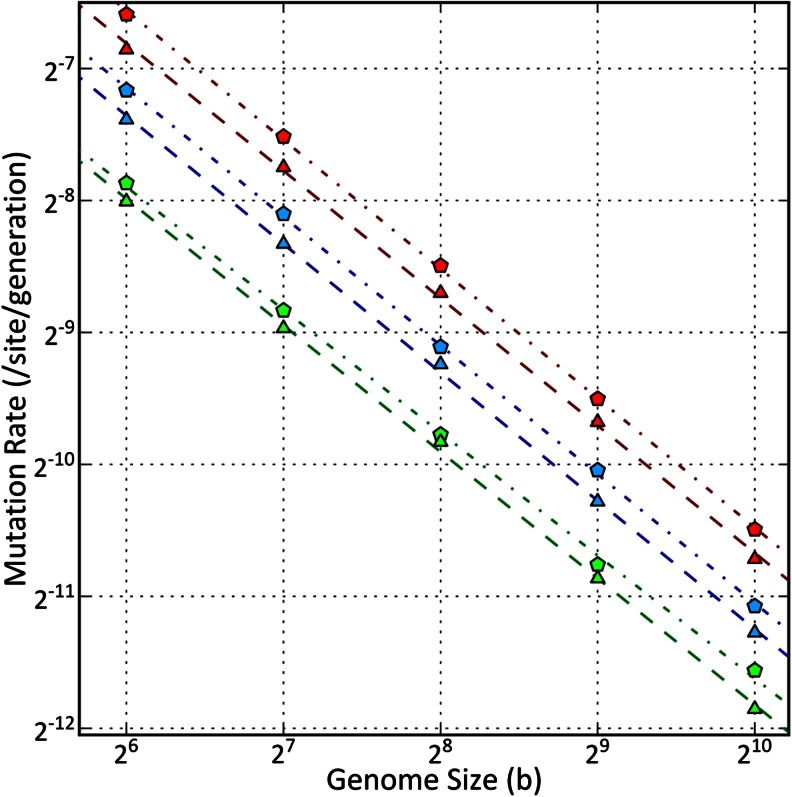
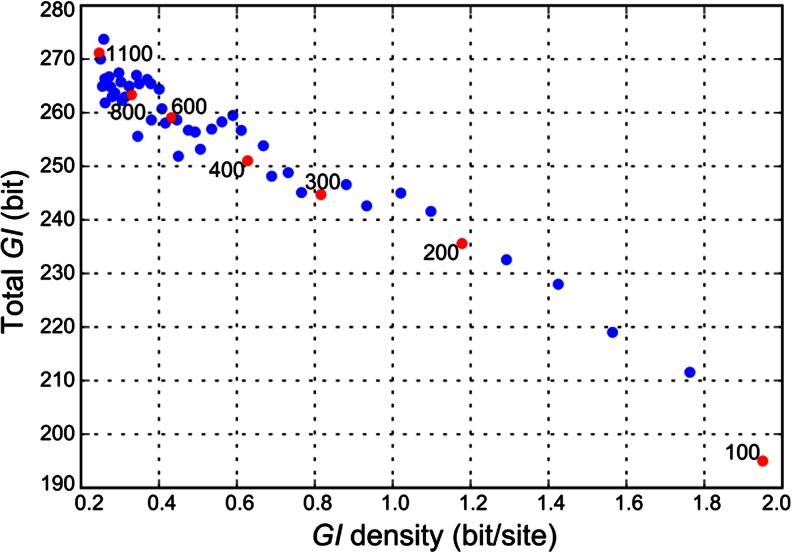
How mutations accumulate in genomes is the central question of molecular evolution theories. However, our understanding of this process is far from complete. Drake's rule is a notoriously universal property of genomes from microbes to mammals-the number of (functional) mutations per-genome per-generation is approximately constant within a phylum, despite the orders of magnitude differences in genome sizes and diverse populations' properties. So far, there is no concise explanation for this phenomenon. A formal model for the storage of genetic information suggests that a genome of any species operates near its maximum informational storage capacity, and the mutation rate per-genome per-generation is near its upper limit, providing a simple explanation for the rule with minimal assumptions.
Figures
Similar articles
-
Correlation between mutation rate and genome size in riboviruses: mutation rate of bacteriophage Qβ.Genetics. 2013 Sep;195(1):243-51. doi: 10.1534/genetics.113.154963. Epub 2013 Jul 12. Genetics. 2013. PMID: 23852383 Free PMC article.
-
Point mutation rate of bacteriophage PhiX174.Genetics. 2009 Oct;183(2):747-9. doi: 10.1534/genetics.109.106005. Epub 2009 Aug 3. Genetics. 2009. PMID: 19652180 Free PMC article.
-
Evidence that DNA repair genes, a family of tumor suppressor genes, are associated with evolution rate and size of genomes.Hum Genomics. 2019 Jun 7;13(1):26. doi: 10.1186/s40246-019-0210-x. Hum Genomics. 2019. PMID: 31174607 Free PMC article.
-
Simple genomes, complex interactions: epistasis in RNA virus.Chaos. 2010 Jun;20(2):026106. doi: 10.1063/1.3449300. Chaos. 2010. PMID: 20590335 Review.
-
Evolutionary and statistical properties of three genetic distances.Mol Ecol. 2002 Aug;11(8):1263-73. doi: 10.1046/j.1365-294x.2002.01520.x. Mol Ecol. 2002. PMID: 12144649 Review.
References
-
- Adami C. Information theory in molecular biology. Phys Life Rev. 2004;1:3–22. doi: 10.1016/j.plrev.2004.01.002. - DOI
-
- Battail G. Information theory and error-correcting codes in genetics and biological evolution. In: Barbieri M, editor. Introduction to Biosemiotics. Dordrecht: Springer; 2007. pp. 299–345.
-
- Battail G. Information and Life. Dordrecht: Springer; 2014.
-
- Chaitin G. Proving Darwin: Making biology mathematical. New York: Pantheon Books; 2012.
MeSH terms
LinkOut - more resources
Full Text Sources
Other Literature Sources
