. 2015 Feb;179(2):277-93.
doi: 10.1111/cei.12457.

Gene silencing of non-obese diabetic receptor family (NLRP3) protects against the sepsis-induced hyper-bile acidaemia in a rat model

Affiliations

Gene silencing of non-obese diabetic receptor family (NLRP3) protects against the sepsis-induced hyper-bile acidaemia in a rat model

Y Wu et al. Clin Exp Immunol. 2015 Feb.

Abstract

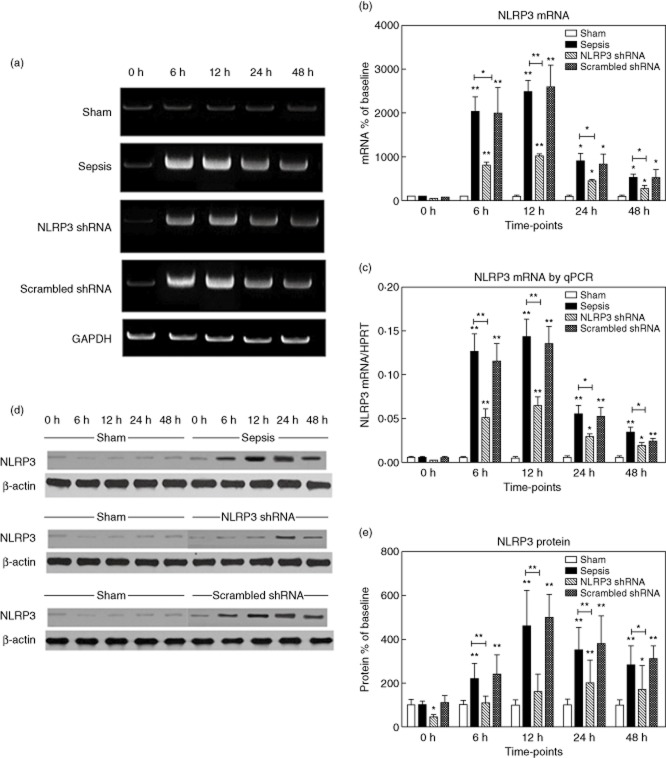
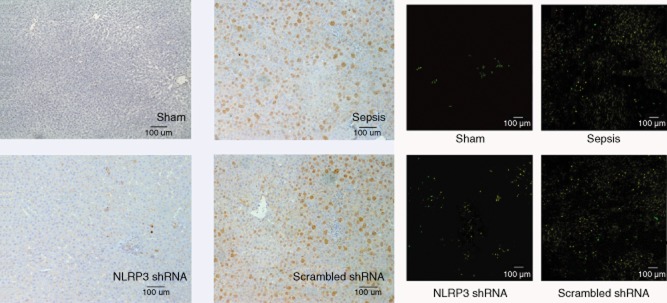
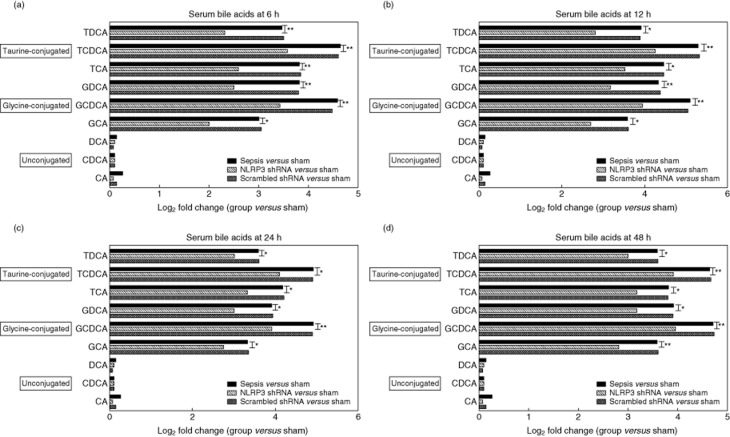
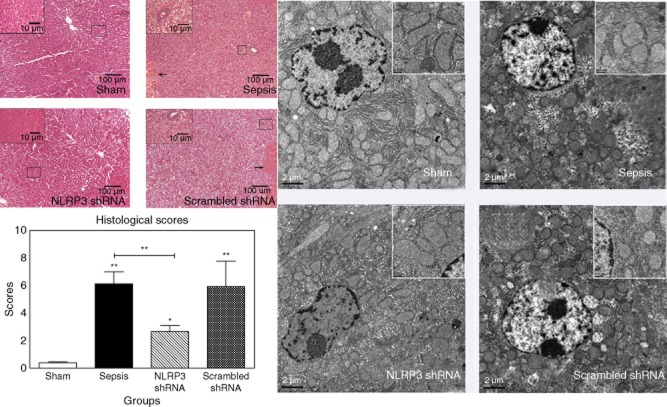
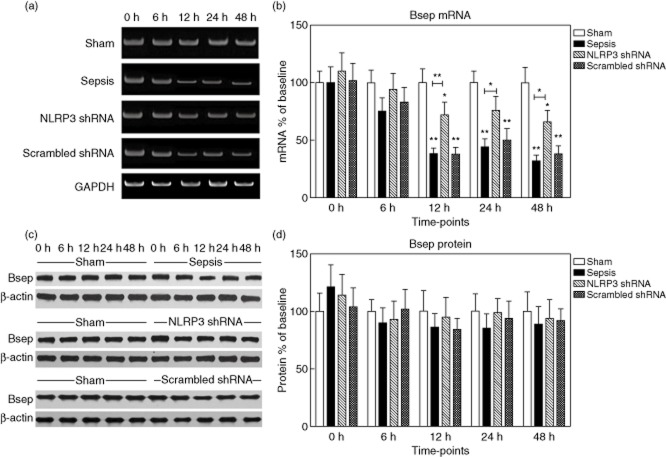
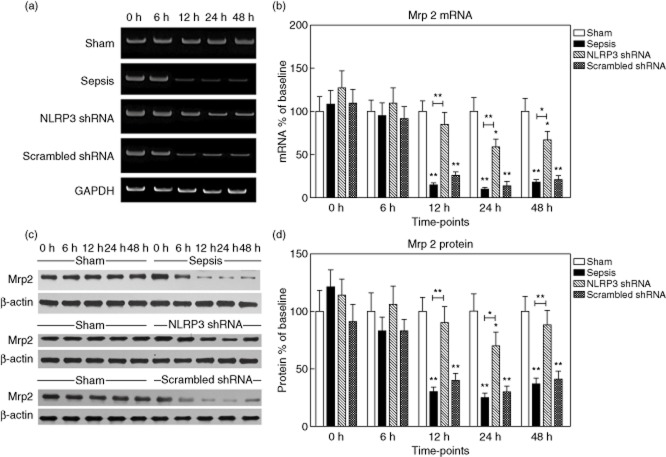
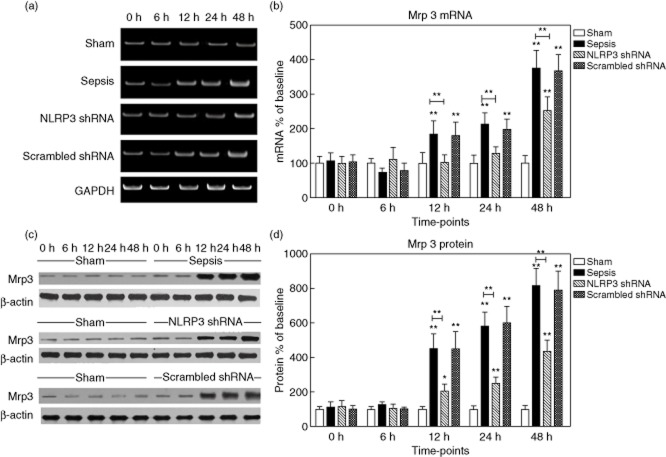
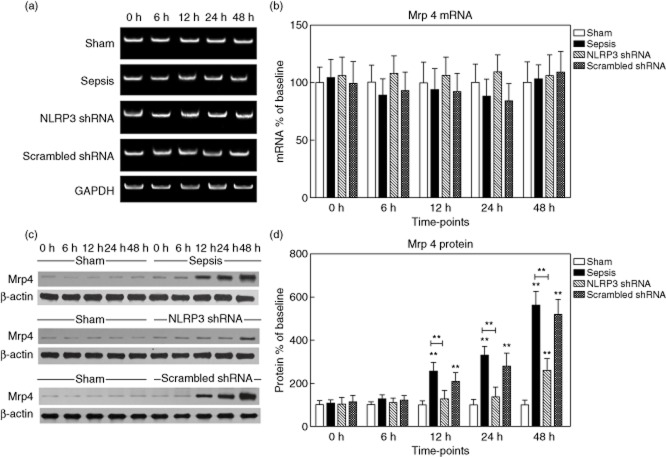
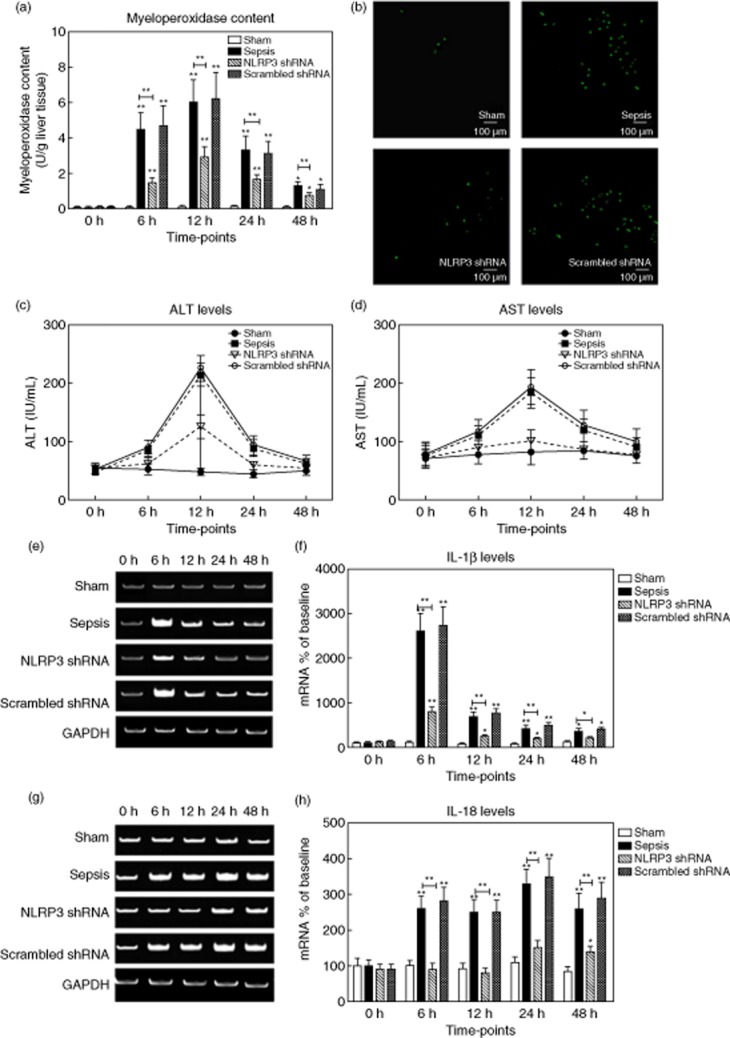
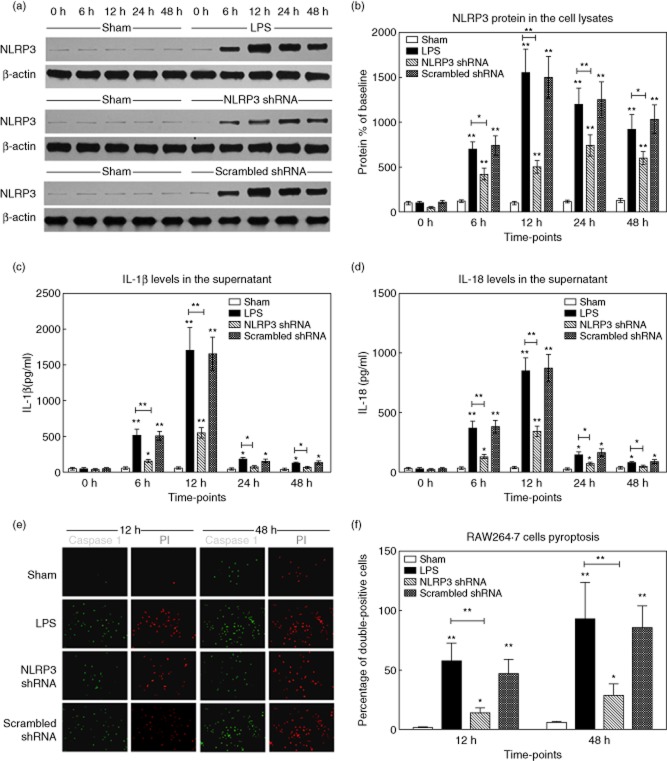
The role of NOD-like receptor family (NLRP3) has been confirmed in various inflammatory diseases. The association between NLRP3 and hyper-bileacidaemia during the sepsis remains unclear. We aimed to investigate whether NLRP3 silencing protects against the sepsis-induced hyper-bileacidaemia. Sepsis was induced by caecum ligation and puncture (CLP). Gene silencing of NLRP3 was performed by injecting rats with NLRP3 short hairpin RNA plasmids (NLRP3 shRNA) 48 h before surgery. Rats were divided into four groups: group 1: sham; group 2: sepsis; group 3: NLRP3 shRNA + sepsis (called the 'NLRP3 shRNA' group); and group 4: scrambled shRNA + sepsis (called the 'scrambled shRNA' group). The serum levels of bile acids, hepatic expression of hepatocyte membrane transporters, hepatic cytokine levels and behaviours of immune cells were compared among the groups. Hepatic NLRP3 expression was increased dramatically during the sepsis, but was suppressed by pretreatment with NLRP3 shRNA. Compared with rats in the sepsis and the scrambled shRNA groups, rats in the NLRP3 shRNA group exhibited significantly decreased serum levels of glycine and taurine conjugated-bile acids, with rehabilitated expression of hepatocyte transporters, suppressed hepatic cytokine levels, decreased hepatic neutrophils infiltration and attenuated macrophages pyroptosis. Gene silencing of NLRP3 ameliorates sepsis-induced hyper-bileacidaemia by rehabilitating hepatocyte transporter expression, reducing hepatic cytokine levels, neutrophil infiltration and macrophages pyroptosis. NLRP3 may be a pivotal target for sepsis management.

Keywords: NLRP3 inflammasome; hyper-bileacidaemia; liver injury; sepsis.


Figures

Figure 1
Figure 1
The hepatic expression of non-obese diabetic-like receptor family (NLRP3). (a,b) The representative images of NLRP3 mRNA expression by real-time–polymerase chain reaction (RT–PCR) from the four groups at indicated time-points and the quantitative analysis of mRNA density. (c) NLRP3 mRNA levels in the four groups were also evaluated by quantitative (q)RT–PCR. (d,e) The representative images of NLRP3 protein expression by Western blot from the four groups and the quantitative analysis of protein density. NLRP3 shRNA represents the group administrated with NLRP3 shRNA and then subjected to caecal ligation and puncture (CLP); scrambled shRNA represents the group administered with scrambled NLRP3 shRNA and then subjected to CLP (the same throughout the paper). Data are expressed as percentages of the baseline value in the sham group. Data represent mean ± standard error of the mean, six per group; the experiments were repeated three times. *P < 0·05 versus baseline value in the sham group; **P < 0·001 versus baseline value in the sham group.
Figure 2
Figure 2
The left panel shows the representative immunohistochemical staining for non-obese diabetic-like receptor family (NLRP3) in the four groups at 12 h after surgery (original magnification ×100). Cells which are positive-stained are shown in brown. The right panel shows the representative immunofluorescent double labelling for NLRP3 (green) and macrophages (red) in the four groups at 12 h after surgery (original magnification ×100). Double-positive cells are shown in yellow.
Figure 3
Figure 3
The graph depicts log2 fold changes (comparing each group to the sham group) of serum unconjugated as well as glycine- and taurine-conjugated bile acids levels at the indicated time-points, six per group; the experiments were repeated three times. *P < 0·05 the sepsis group versus the non-obese diabetic-like receptor family (NLRP3) shRNA group; **P < 0·001 the sepsis group versus the NLRP3 shRNA group. TDCA: taurodeoxycholic acid; TCDCA: taurochenodeoxycholic acid; TCA: taurocholic acid; GDCA: glycodeoxycholic acid; GCDCA, glycochenodeoxycholic acid; GCA: glycocholic acid; DCA, deoxycholic acid; CDCA: chenodeoxycholic acid; CA: cholic acid.
Figure 4
Figure 4
The left panel shows representative histological images at 48 h after surgery (haematoxylin and eosin staining, original magnification ×100 or ×400). The large black box indicates the amplification of the zone marked with the small box. Arrows point to the necrosis area. The right panel shows representative electron microscopy images at 48 h after surgery (scale bars: 2 μm). The large white box indicates the enlarged images of local area. Data represent mean ± standard deviation, six per group; the experiments were repeated three times.*P < 0·05 versus the sham group; **P < 0·001 versus the sham group.
Figure 5
Figure 5
Expression of bile salt export pump (Bsep) in the liver tissues. (a,b) The representative images of Bsep mRNA expression by real-time–polymerase chain reaction (RT–PCR) from the four groups at the indicated time-points and the quantitative analysis of mRNA density. (c,d) The representative images of Bsep protein expression by Western blot from the four groups and the quantitative analysis of protein density. Data are expressed as percentages of the baseline value in the sham group. Data represent mean ± standard deviation, six per group; the experiments were repeated three times. *P < 0·05 versus baseline value in the sham group; **P < 0·001 versus baseline value in the sham group.
Figure 6
Figure 6
Expression of multi-drug resistance-associated protein 2 (Mrp2) in the liver tissues. (a,b) The representative images of Mrp2 mRNA expression by real-time–polymerase chain reaction (RT–PCR) from the four groups at the indicated time-points and the quantitative analysis of mRNA density. (c,d) The representative images of Mrp2 protein expression by Western blot from the four groups and the quantitative analysis of protein density. Data are expressed as percentages of the baseline value in the sham group. Data represent mean ± standard deviation, six per group; the experiments were repeated three times. *P < 0·05 versus baseline value in the sham group; **P < 0·001 versus baseline value in the sham group.
Figure 7
Figure 7
Expression of multi-drug resistance-associated protein 3 (Mrp3) in the liver tissues. (a,b) The representative images of Mrp3 mRNA expression by real-time–polymerase chain reaction (RT–PCR) from the four groups at the indicated time-points and the quantitative analysis of mRNA density. (c,d) The representative images of Mrp3 protein expression by Western blot from the four groups and the quantitative analysis of protein density. Data are expressed as percentages of the baseline value in the sham group. Data represent mean ± standard deviation, six per group; the experiments were repeated three times. *P < 0·05 versus baseline value in the sham group; **P < 0·001 versus baseline value in the sham group.
Figure 8
Figure 8
Expression of multi-drug resistance-associated protein 4 (Mrp4) in the liver tissues. (a,b) The representative images of Mrp4 mRNA expression by real-time–polymerase chain reaction (RT–PCR) from the four groups at the indicated time-points and the quantitative analysis of mRNA density. (c,d) The representative images of Mrp4 protein expression by Western blot from the four groups and the quantitative analysis of protein density. Data are expressed as percentages of the baseline value in the sham group. Data represent mean ± standard deviation, six per group; the experiments were repeated three times. *P < 0·05 versus baseline value in the sham group; **P < 0·001 versus baseline value in the sham group.
Figure 9
Figure 9
(a,b) Hepatic neutrophil infiltration was determined by myeloperoxidase (MPO) levels. The representative immunofluorescent stainings for neutrophils (green) at 12 h after surgery (original magnification ×100). (c,d) Serum alanine aminotransferase (ALT) and aspartate aminotransferase (AST) levels (IU/ml) were measured in rats from the four groups. (e,f) The representative images of interleukin (IL)-1β mRNA expression by real-time–polymerase chain reaction (RT–PCR) from the four groups at the indicated time-points and the quantitative analysis of mRNA density. (g,h) The representative images of IL-18 mRNA expression by RT–PCR from the four groups and the quantitative analysis of mRNA density. Data are expressed as percentages of the baseline value in the sham group. Data represent mean ± standard deviation, six per group; the experiments were repeated three times. *P < 0·05 versus baseline value in the sham group; **P < 0·001 versus baseline value in the sham group.
Figure 10
Figure 10
Gene silencing of non-obese diabetic-like receptor family (NLRP3) in-vitro cell experiments. RAW264·7 cells were transfected with NLRP3 shRNA or scrambled shRNA. The stably transfected cells were stimulated or not with lipopolysaccharide (LPS) (100 ng/ml) for different periods. (a,b) The cell lysates were collected and NLRP3 protein levels were measured by Western blot. The representative images of NLRP3 protein expression and the quantitative analysis of protein density. (c,d) The supernatants in cells culture media from the four groups were analysed for IL-1β and IL-18 by enzyme-linked immunosorbent assay (ELISA). (e) The representative fluorescence microscopy images of pyroptic cells (original magnification ×200). The caspase-1 (green) and propidium iodide (PI) (red) signals were captured, respectively. (f) The percentages of caspase-1 and PI double-positive cells from the four groups at 12 h and 48 h after stimulation. Data are expressed as percentages of the baseline value in the sham group. Data represent mean ± standard deviation; the experiments were repeated three times. *P < 0·05 versus baseline value in the sham group; **P < 0·001 versus baseline value in the sham group.

References

    1. Marshall JC. The liver in sepsis: shedding light on the cellular basis of hepatocyte dysfunction. Crit Care. 2013;17:153–154. - PMC - PubMed
    1. Recknagel P, Gonnert FA, Westermann M. Liver dysfunction and phosphatidylinositol-3-kinase signalling in early sepsis: experimental studies in rodent models of peritonitis. PLOS Med. 2012;9:e1001338. - PMC - PubMed
    1. Sturm E, Wagner M, Trauner M. Nuclear receptor ligands in therapy of cholestatic liver disease. Front Biosci (Landmark edn) 2009;14:4299–4325. - PubMed
    1. Muller M, Jansen PL. Molecular aspects of hepatobiliary transport. Am J Physiol. 1997;272:G1285–1303. - PubMed
    1. Mennone A, Soroka CJ, Cai SY. Mrp4–/– mice have an impaired cytoprotective response in obstructive cholestasis. Hepatology. 2006;43:1013–1021. - PubMed

Publication types

MeSH terms