. 2014 Oct:247:118-127.
doi: 10.1016/j.jmr.2014.08.007. Epub 2014 Aug 25.

Probing membrane protein structure using water polarization transfer solid-state NMR

Affiliations

Probing membrane protein structure using water polarization transfer solid-state NMR

Jonathan K Williams et al. J Magn Reson. 2014 Oct.

Abstract

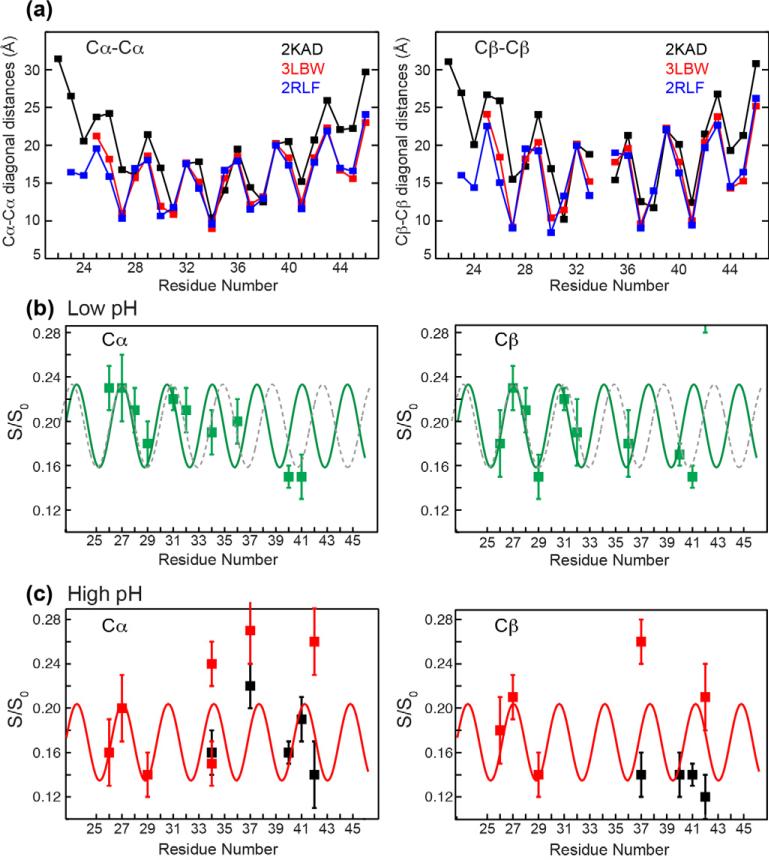
Water plays an essential role in the structure and function of proteins, lipid membranes and other biological macromolecules. Solid-state NMR heteronuclear-detected (1)H polarization transfer from water to biomolecules is a versatile approach for studying water-protein, water-membrane, and water-carbohydrate interactions in biology. We review radiofrequency pulse sequences for measuring water polarization transfer to biomolecules, the mechanisms of polarization transfer, and the application of this method to various biological systems. Three polarization transfer mechanisms, chemical exchange, spin diffusion and NOE, manifest themselves at different temperatures, magic-angle-spinning frequencies, and pulse irradiations. Chemical exchange is ubiquitous in all systems examined so far, and spin diffusion plays the key role in polarization transfer within the macromolecule. Tightly bound water molecules with long residence times are rare in proteins at ambient temperature. The water polarization-transfer technique has been used to study the hydration of microcrystalline proteins, lipid membranes, and plant cell wall polysaccharides, and to derive atomic-resolution details of the kinetics and mechanism of ion conduction in channels and pumps. Using this approach, we have measured the water polarization transfer to the transmembrane domain of the influenza M2 protein to obtain information on the structure of this tetrameric proton channel. At short mixing times, the polarization transfer rates are site-specific and depend on the pH, labile protons, sidechain conformation, as well as the radial position of the residues in this four-helix bundle. Despite the multiple dependences, the initial transfer rates reflect the periodic nature of the residue positions from the water-filled pore, thus this technique provides a way of gleaning secondary structure information, helix tilt angle, and the oligomeric structure of membrane proteins.

Keywords: Chemical exchange; Heteronuclear correlation; Influenza M2 protein; Ion channels; Spin diffusion.


Figures

Figure 1
Figure 1
Representative pulse sequences used to measure water polarization transfer to biomolecules. (a) 1D T2-filtered experiment. (b) 2D 1H-undecoupled HETCOR experiment with spin diffusion mixing. (c) 2D dipolar-dephased MELODI-HETCOR experiment. (d) 1H-detected 1D XHH experiment for sensitivity-enhanced detection of biomolecule-water polarization transfer.
Figure 2
Figure 2
Main mechanisms of water-biomolecule polarization transfer (a) and applications of solid-state NMR to investigations of water-protein and water-polysaccharide interactions (b-e). (a) Water protons can transfer polarization to biomolecules via chemical exchange, dipolar spin diffusion, and NOE. (b) Distinguishing liquid water and ice by solid-state NMR provide structural information on ice-binding proteins. (c) Water polarization transfer to ion channels has been used to investigate ion conduction kinetics, oligomeric structure of the channel, and to identify lipid-facing versus pore-facing residues. (d) Water-edited solid-state NMR experiments have been conducted to determine the topology of membrane proteins in terms of surface-exposed loops (left) and helices (right) versus membrane-embedded residues. (e) Distinct water interactions with different polysaccharides of the plant cell wall have been studied to provide information on the three-dimensional structure of the cell wall.
Figure 3
Figure 3
(a) Backbone N-N distances between two opposite helices in the tetrameric M2TM. The distances are extracted from three PDB structures of M2 with distinct helix tilt angles. The SSNMR structure 2KAD has a large tilt angle (~35°) that is expected for the low-pH state. The pH 6.5 crystal structure 3LBW has an intermediate helix tilt angle. The solution NMR structure 2RLF has the smallest tilt angle (~15°) and was measured at high pH. Periodic oscillation of the nitrogen distances to water, which is half the N-N distance plotted here, is seen for all structures. (b) Top view of the four-helix bundle formed by M2TM, showing the positions of the 12 labeled residues on the heptad repeat. Positions a and d (red) face the water-filled pore, e and g (blue) are interfacial, and c, f, and b (black) face lipids.
Figure 4
Figure 4
Representative water-M2TM 1H spin diffusion spectra. (a) 2D spectrum of the pH 4.5 GHI sample with 4 ms mixing. (b) 2D spectrum of the pH 4.5 LW sample with 100 ms mixing. In addition to water-protein cross peaks, lipid-protein cross peaks are also observed at the 1H chemical shift of 1.3 ppm, consistent with the transmembrane orientation of the channel. (c) Water 1H cross sections of the low-pH GHI spectra with 4 ms (red) and 100 ms (black) mixing. (d-f) Low pH (left) and high pH (right) water 1H cross sections at 4 ms and 100 ms mixing for (d) GHI, (e) LVAG, and (f) LW samples. Only the aliphatic region is shown for clarity.
Figure 5
Figure 5
Spin diffusion intensity ratios (S/S0) between 4 ms and 100 ms for all measured residues. (a) Cα, (b) Cβ, and (c) Cγ. Horizontal axis indicates the residue number as well as the heptad-repeat positions. Grey bars indicate residues that lie at the a and d positions. Data obtained at pH 4.5 (green), pH 7 or 7.5 (red) and pH 8.5 (black) are superimposed.
Figure 6
Figure 6
Backbone to sidechain trends in the water polarization-transfer intensities, S/S0. (a) GHI sample. (b) LVAG sample. Open symbols in the V27 panel were data measured with shorter mixing times of 1 ms and 2 ms. (c) LW sample. Data measured at pH 4.5 are shown in green, at pH 7.0 and 7.5 in red, and at pH 8.5 in black. The residue's heptad positions are indicated.
Figure 7
Figure 7
Residue-specific periodicity in the water polarization transfer to Cα and Cβ sites. (a) Extracted Cα-Cα and Cβ-Cβ diagonal distances in the M2TM tetramer, which correspond to twice the distances of these atoms to the center of the water-filled pore. Distances are extracted from three PDB structures with distinct helix tilt angles. (b) Low-pH S/S0 values of Cα and Cβ. Solid lines are empirical fits constrained by the ideal helical structure of 3.6 residues per turn, while grey dashed lines give an alternative fit with 4 residues per turn. (c) High-pH S/S0 values. Solid lines are empirical fits following the ideal helical structure. The GHI data are not included in these fits.

References

    1. Halle B. Protein hydration dynamics in solution: a critical survey. Phil. Trans. R. Soc. Lond. B. 2004;359:1207–1223. - PMC - PubMed
    1. Meyer E. Internal water molecules and H-bonding in biological macromolecules: a review of structural features with functional implications. Protein Sci. 1992;1:1543–1562. - PMC - PubMed
    1. Rand RP. Probing the role of water in protein conformation and function. Phil. Trans. R. Soc. Lond. B. 2004;359:1277–1284. - PMC - PubMed
    1. Swanson JMJ, Maupin CM, Chen H, Petersen MK, Xu J, Wu Y, Voth GA. Proton Solvation and Transport in Aqueous and Biomolecular Systems: Insights from Computer Simulations. J. Phys. Chem. B. 2007;111:4300–4314. - PMC - PubMed
    1. Otting G, Liepinsh E, Wüthrich K. Protein hydration in aqueous solution. Science. 1991;254:974–980. - PubMed

Publication types

MeSH terms

LinkOut - more resources