. 2014 Sep 15;28(18):1999-2012.
doi: 10.1101/gad.250225.114.

The SAGA coactivator complex acts on the whole transcribed genome and is required for RNA polymerase II transcription

Affiliations

The SAGA coactivator complex acts on the whole transcribed genome and is required for RNA polymerase II transcription

Jacques Bonnet et al. Genes Dev. .

Abstract

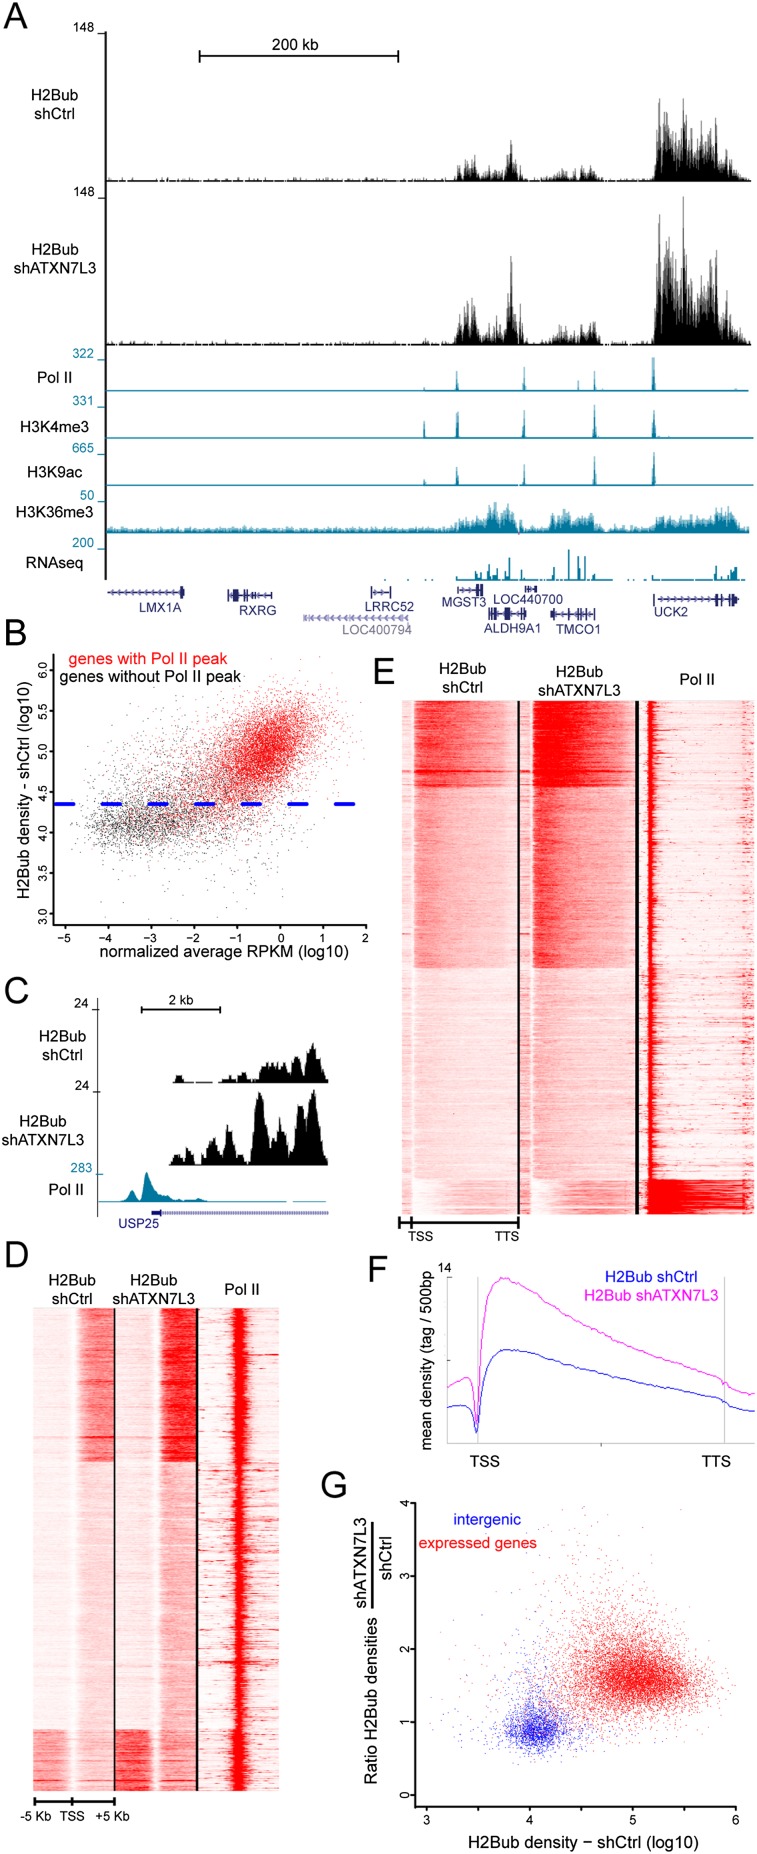
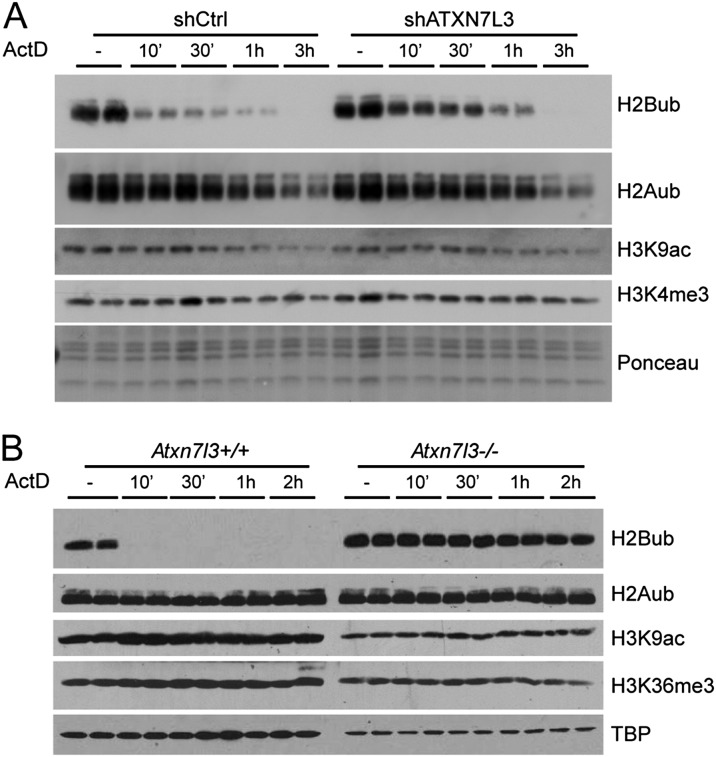
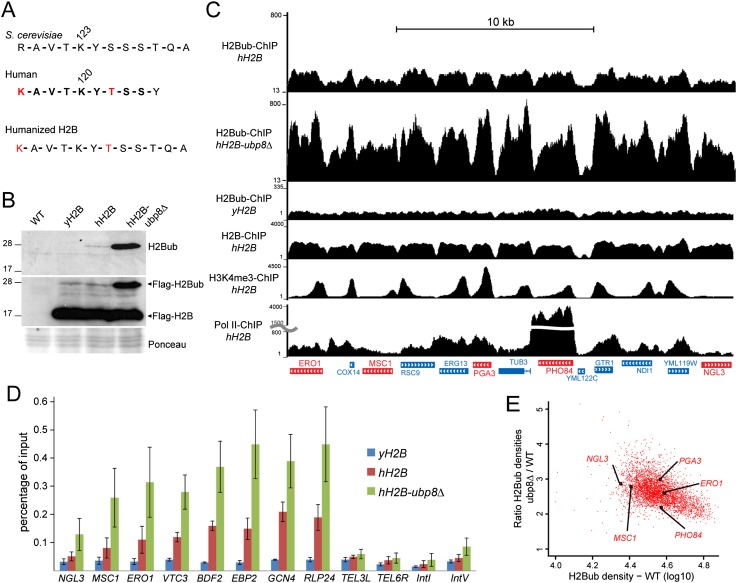
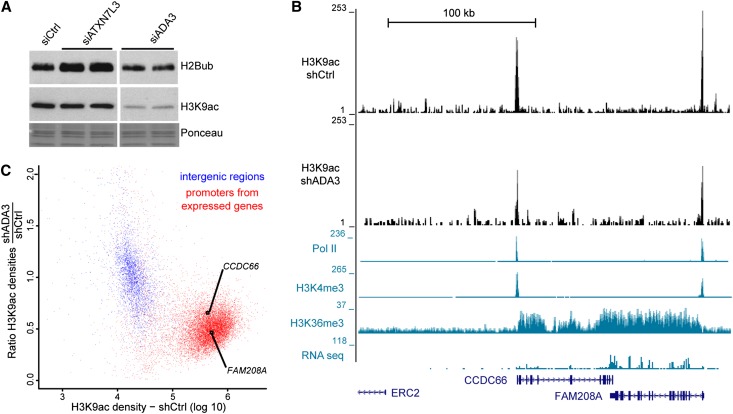
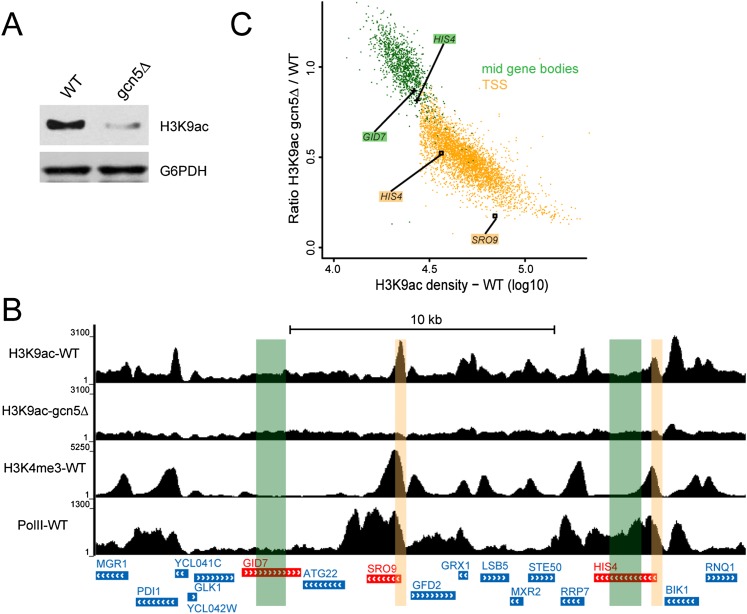
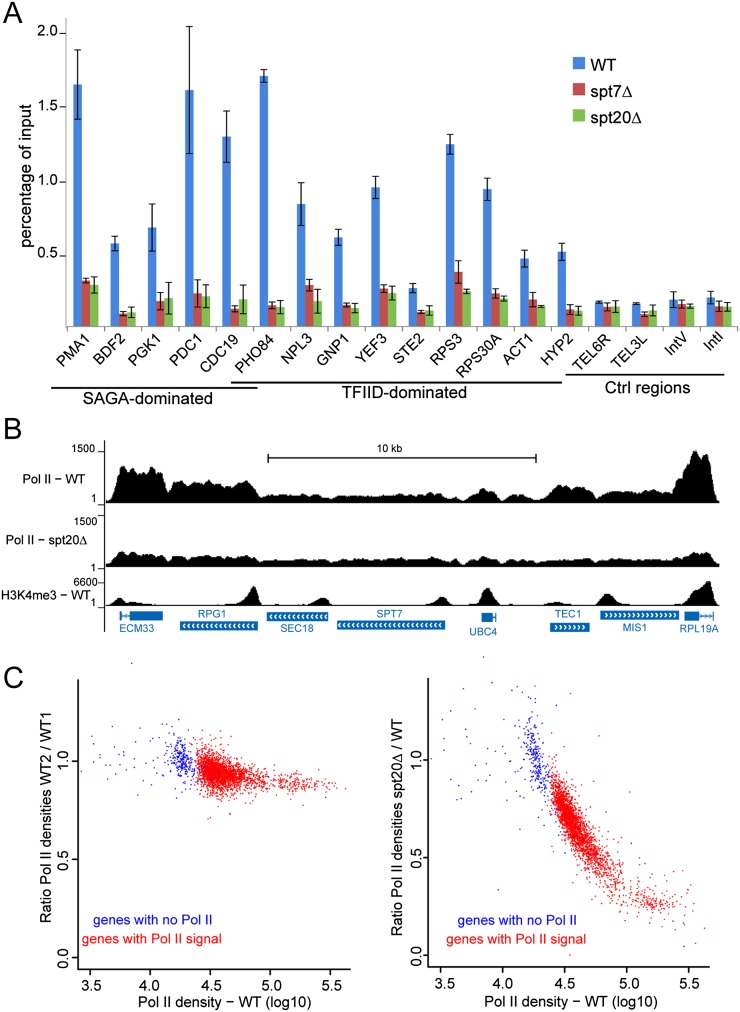
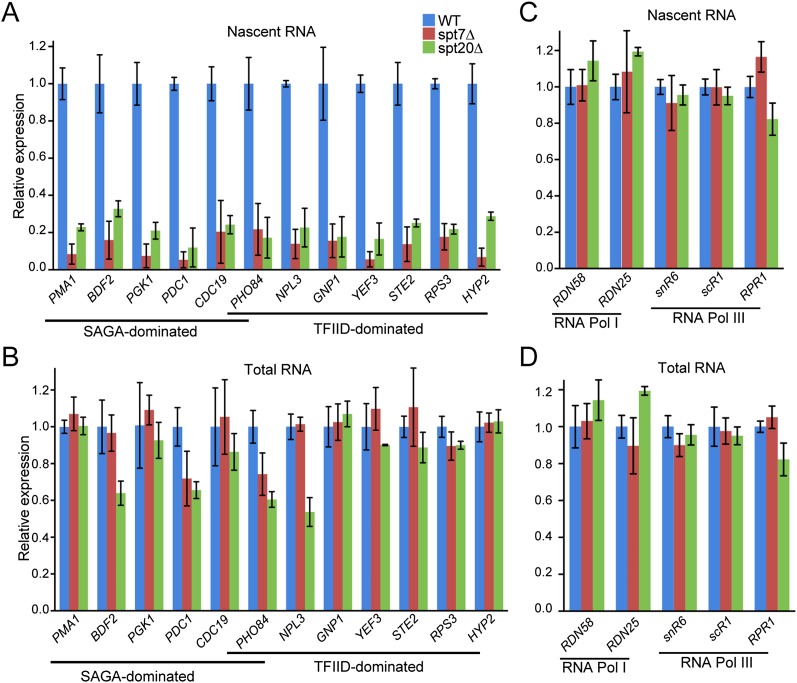
The SAGA (Spt-Ada-Gcn5 acetyltransferase) coactivator complex contains distinct chromatin-modifying activities and is recruited by DNA-bound activators to regulate the expression of a subset of genes. Surprisingly, recent studies revealed little overlap between genome-wide SAGA-binding profiles and changes in gene expression upon depletion of subunits of the complex. As indicators of SAGA recruitment on chromatin, we monitored in yeast and human cells the genome-wide distribution of histone H3K9 acetylation and H2B ubiquitination, which are respectively deposited or removed by SAGA. Changes in these modifications after inactivation of the corresponding enzyme revealed that SAGA acetylates the promoters and deubiquitinates the transcribed region of all expressed genes. In agreement with this broad distribution, we show that SAGA plays a critical role for RNA polymerase II recruitment at all expressed genes. In addition, through quantification of newly synthesized RNA, we demonstrated that SAGA inactivation induced a strong decrease of mRNA synthesis at all tested genes. Analysis of the SAGA deubiquitination activity further revealed that SAGA acts on the whole transcribed genome in a very fast manner, indicating a highly dynamic association of the complex with chromatin. Thus, our study uncovers a new function for SAGA as a bone fide cofactor for all RNA polymerase II transcription.

Keywords: RNA polymerase II; SAGA; acetyltransferase; chromatin; deubiquitinase; transcription.


Figures

Figure 1.
Figure 1.
SAGA acts in the transcribed region of all expressed genes in HeLa cells. (A) Genome browser tracks depicting H2Bub distribution at a representative region in control and ATXN7L3 knockdown HeLa cells. H2Bub localized in the transcribed region of expressed genes that are characterized by Pol II, H3K4me3, and H3K9ac peaks at their promoter; H3K36me3 signal on the gene body; and RNA sequencing (RNA-seq) reads on exons. (B) Gene expression levels (based on normalized average RPKM [reads per kilobase per million mapped reads]) were plotted versus the H2Bub densities on the corresponding gene bodies. The blue dotted line indicates the background density of H2Bub in control HeLa cells (95% of intergenic regions have lower H2Bub densities). Significant H2Bub and RNA-seq reads are found at most of the 10,934 genes that have a Pol II peak at their promoter (red dots) but not at the majority of the 8363 genes devoid of Pol II (black dots). When considering expressed genes, a very weak correlation (Pearson correlation coefficient, 0.20) could be observed between H2Bub levels and gene expression, indicating that H2B ubiquitination is not solely related to gene expression levels. (C) Absence of H2Bub at the promoter of an expressed gene in control and ATXN7L3 knockdown HeLa cells. (D,E) Heat maps showing the distribution of H2Bub in control HeLa cells (H2Bub shCtrl) and after the inactivation of SAGA DUB activity (H2Bub shATXN7L3) around the TSS (TSS −5 kb/+5 kb) (D) and on bodies of expressed genes (from TSS to TTS) (E). Nine-thousand-six-hundred-thirty genes with a Pol II peak at the TSS were considered. (F) Average profiles depicting H2Bub distribution on gene bodies. Upon inactivation of SAGA DUB activity, H2Bub is not increased at the promoter of expressed genes (C,D) but increases on the body of expressed genes (E,F). (G) Scatter plots representing H2Bub densities in control cells relative to SAGA DUB activity (ratio of H2Bub densities in shATXN7L3 and shCtrl cells). Two-thousand-eight-hundred-forty-nine intergenic regions (blue dots) were compared with 10,486 expressed genes (red dots).
Figure 2.
Figure 2.
SAGA mediates a very fast reversal of H2B ubiquitination upon transcription inhibition. Control (left panels) and ATXN7L3 knockdown (right panels) HeLa cells (A) or Atxn7l3 knockout mESCs (B, right panels) were treated with actinomycin D for the indicated time points. Acidic extracts were analyzed by Western blotting using the indicated antibodies.
Figure 3.
Figure 3.
H2Bub ChIP-seq analyses in budding yeast expressing a humanized histone H2B reveal a global distribution of the SAGA DUB activity. (A,B) A humanized version of the yeast histone H2B is efficiently ubiquitinated and recognized by an anti-human H2Bub antibody. (A) S. cerevisiae and human H2B protein sequence comparison around their ubiquitination sites. The peptide used to raise the anti-H2Bub antibody (in bold) contains two residues (in red) that are not conserved in the yeast H2B. hH2B was obtained by mutating these two residues into their human counterpart. (B) H2B ubiquitination in htb1htb2∆ yeast strains expressing Flag-tagged yH2B or hH2B and after further UBP8 deletion (hH2B-ubp8Δ) was analyzed by immunoblotting using an anti-H2Bub (top panel) or an anti-Flag (middle panel) antibody. (C) H2Bub ChIP-seq analyses in S. cerevisiae expressing hH2B (H2Bub-ChIP hH2B) and after further UBP8 deletion (H2Bub-ChIP hH2B-ubp8Δ) or the unmodified yH2B (H2Bub-ChIP yH2B). Genome browser tracks of a representative genomic region showing H2Bub enrichment in gene bodies. Representative genes shown in E are indicated in red. H2B, H3K4me3, and Pol II profiles in the hH2B background are shown in the lower tracks. (D) H2Bub ChIP was performed on yH2B, hH2B, and hH2B-ubp8∆ strains. H2Bub levels were quantified by real-time quantitative PCR (qPCR) on bodies of active genes and control intergenic regions (TEL3L, TEL6R, IntI, and IntV). The values (mean ± SD of three independent ChIP experiments) are expressed as percentage of input DNA signal. (E) Scatter plot showing a homogenous SAGA DUB activity on the 3916 expressed genes. The ratios of H2Bub densities on gene bodies between hH2B-ubp8Δ and hH2B strains were plotted against the H2Bub densities.
Figure 4.
Figure 4.
All active Pol II promoters are acetylated by GCN5-containing complexes in human cells. (A) Western blot analyses of changes in H2B ubiquitination and H3K9ac upon inactivation of the corresponding enzymes. Total histones were purified by acidic extractions from HeLa cells transfected with the specified siRNA and immunoblotted with the indicated antibodies. (B,C) Analysis of H3K9ac ChIP-seq profiles in control and ADA3 knockdown HeLa cells. (B) Genome browser tracks at a representative region reveal that H3K9ac peak intensity at the promoter of expressed genes in HeLa cells (H3K9ac-shCtrl) drops upon ADA3 knockdown (H3K9ac-shADA3). (C) GCN5 HAT activity (ratio of H3K9ac densities in shADA3 and shCtrl cells) was plotted relative to H3K9ac densities in 3189 intergenic regions (blue dots) and 11,300 regions surrounding the TSS of expressed genes (TSS −1.5 kb/+3.5 kb; red dots). Promoters of expressed genes shown in B are indicated.
Figure 5.
Figure 5.
Gcn5 acetylates H3K9 at the promoter of all expressed genes in yeast. (A) Whole-cell extracts from wild-type (WT) and gcn5∆ yeasts were prepared in an 8 M urea buffer and probed as indicated. (B,C) Analysis of H3K9ac ChIP-seq profiles in wild-type and gcn5∆ yeast cells. (B) Genome browser tracks of a representative yeast genomic region. H3K9ac peaks detected in wild-type cells (H3K9ac-WT) are absent when GCN5 is deleted (H3K9ac-gcn5∆). Expressed genes are characterized by an H3K4me3 peak at their promoter (H3K4me3-WT) and a Pol II signal on the gene body (Pol II-WT). (C) Scatter plot representing Gcn5 acetylation activity (ratio of H3K9ac densities in gcn5∆ and wild type) versus H3K9ac density in 3916 regions centered on the first codon (±200 base pairs [bp]) of expressed yeast genes as defined by the presence of H3K4me3 and H3K9ac peaks at the TSS (yellow dots) or in 1184 mid-gene bodies of large genes (from 25% to 75% of gene bodies >2 kb; green dots). Promoters and control regions highlighted in B are indicated.
Figure 6.
Figure 6.
SAGA is required for RNA Pol II recruitment at both SAGA- and TFIID-dominated genes. (A) Pol II ChIP-qPCR performed on chromatin extracted from wild-type (WT), spt7Δ, and spt20Δ yeast cells on SAGA- and TFIID-dominated genes or in control intergenic regions (mean ± SD, n = 2). (B,C) Pol II ChIP-seq analysis in S. cerevisiae wild type and spt20Δ. (B) Genome browser tracks of a representative genomic region show decreased Pol II occupancy in the spt20Δ strain. (C, left panel) Scatter plot showing the reproducibility of Pol II ChIP performed on two independent wild-type chromatin preparations. (Right panel) A global loss of Pol II recruitment in spt20Δ cells is observed on 2606 active genes with H3K9ac and H3K4me3 peaks at the TSS and significant Pol II signal (red dots). Data were normalized on 291 genes that have background levels of Pol II and lack H3K4me3 and H3K9ac (blue dots).
Figure 7.
Figure 7.
SAGA is required for RNA Pol II transcription of either SAGA- or TFIID-dominated genes. Newly synthesized (A,C) and total (B,D) mRNA were extracted from wild-type (WT), spt7Δ, and spt20Δ yeast cells. mRNA from SAGA- and TFIID-dominated genes (A,B) or RNA Pol I and RNA Pol III genes (C,D) were quantified by real-time PCR. Results were normalized to S. pombe tubulin expression and are presented as fold variation in comparison with the wild type (mean ± SD, n = 3).

References

    1. Armour S, Bennett E, Braun C, Zhang X-Y, McMahon S, Gygi S, Harper J, Sinclair D. 2013. A high-confidence interaction map identifies SIRT1 as a mediator of acetylation of USP22 and the SAGA coactivator complex. Mol Cell Biol 33: 1487–1502 - PMC - PubMed
    1. Basehoar AD, Zanton SJ, Pugh BF. 2004. Identification and distinct regulation of yeast TATA box-containing genes. Cell 116: 699–709 - PubMed
    1. Bian C, Xu C, Ruan J, Lee K, Burke T, Tempel W, Barsyte D, Li J, Wu M, Zhou B, et al. . 2011. Sgf29 binds histone H3K4me2/3 and is required for SAGA complex recruitment and histone H3 acetylation. EMBO J 30: 2829–2842 - PMC - PubMed
    1. Gamper A, Kim J, Roeder R. 2009. The STAGA subunit ADA2b is an important regulator of human GCN5 catalysis. Mol Cell Biol 29: 266–280 - PMC - PubMed
    1. Gardner RG, Nelson ZW, Gottschling DE. 2005. Ubp10/Dot4p regulates the persistence of ubiquitinated histone H2B: distinct roles in telomeric silencing and general chromatin. Mol Cell Biol 25: 6123–6139 - PMC - PubMed

Publication types

MeSH terms

Associated data