Multicenter Study
. 2014 Nov;7(6):863-71.
doi: 10.1161/CIRCIMAGING.114.002411. Epub 2014 Sep 16.

Prediction of sarcomere mutations in subclinical hypertrophic cardiomyopathy

Affiliations
Multicenter Study

Prediction of sarcomere mutations in subclinical hypertrophic cardiomyopathy

Gabriella Captur et al. Circ Cardiovasc Imaging. 2014 Nov.

Abstract

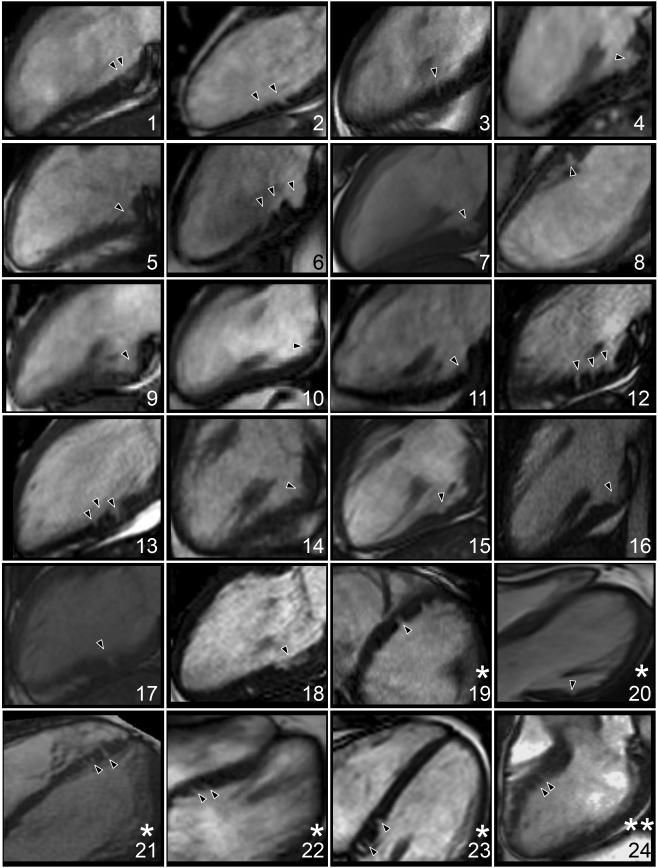
Background: Sarcomere protein mutations in hypertrophic cardiomyopathy induce subtle cardiac structural changes before the development of left ventricular hypertrophy (LVH). We have proposed that myocardial crypts are part of this phenotype and independently associated with the presence of sarcomere gene mutations. We tested this hypothesis in genetic hypertrophic cardiomyopathy pre-LVH (genotype positive, LVH negative [G+LVH-]).

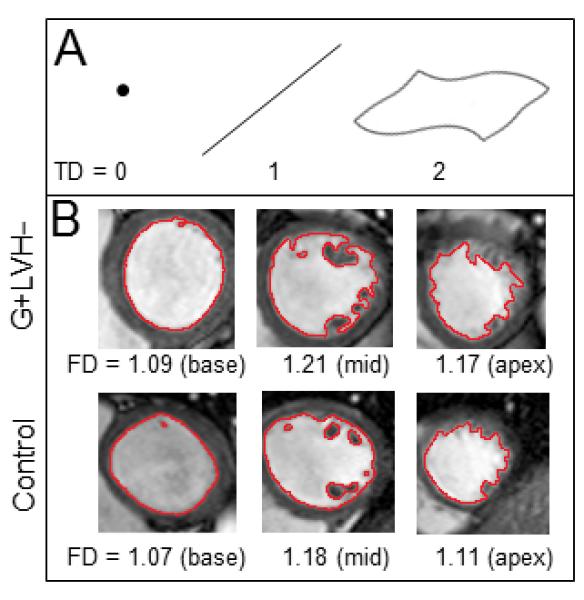
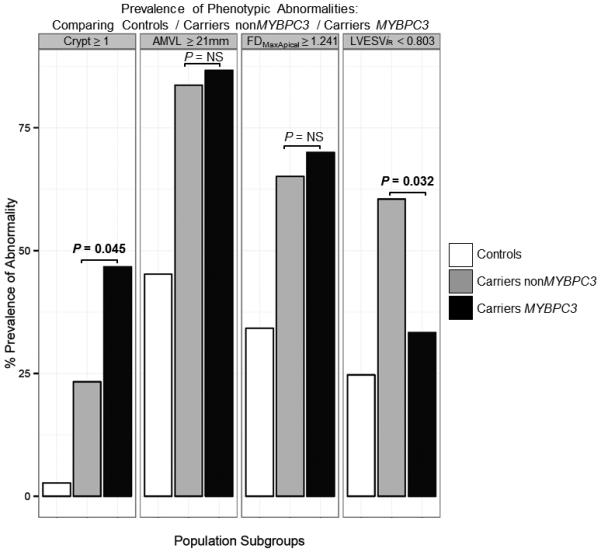
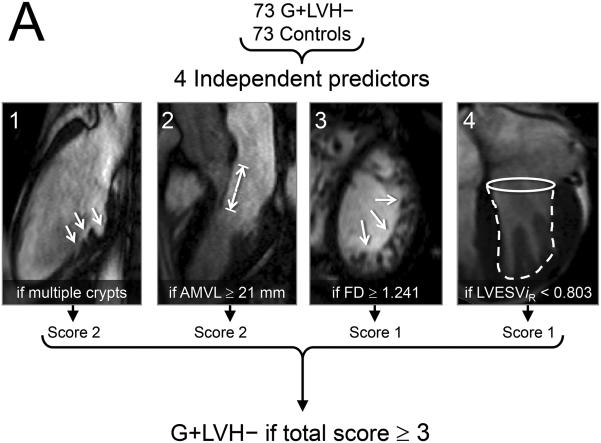
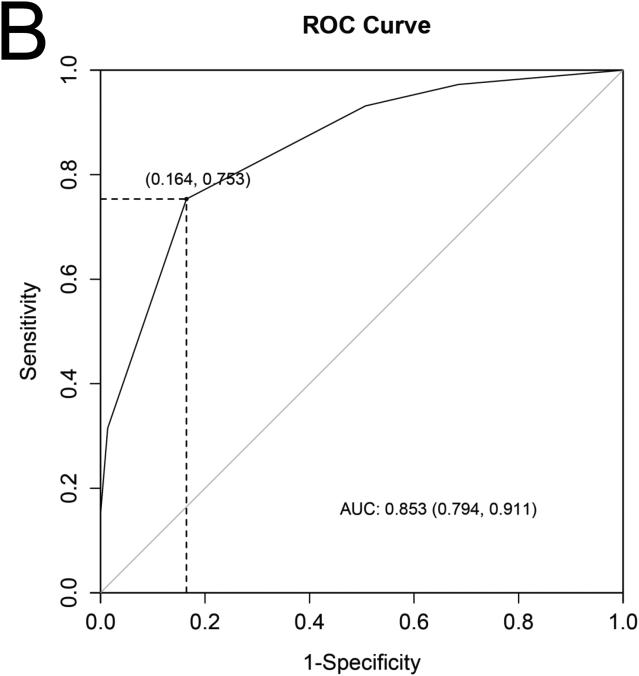
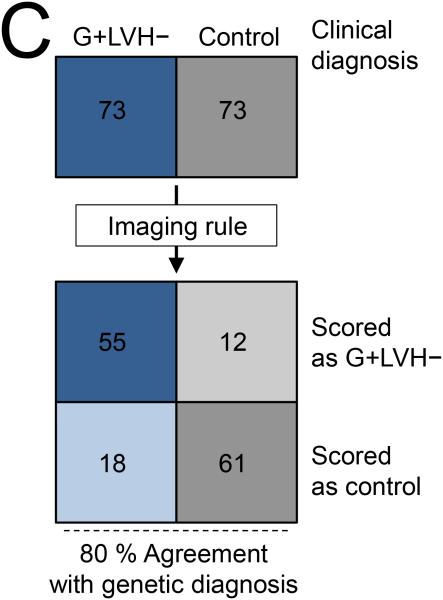
Methods and results: A multicenter case-control study investigated crypts and 22 other cardiovascular magnetic resonance parameters in subclinical hypertrophic cardiomyopathy to determine their strength of association with sarcomere gene mutation carriage. The G+LVH- sample (n=73) was 29 ± 13 years old and 51% were men. Crypts were related to the presence of sarcomere mutations (for ≥1 crypt, β=2.5; 95% confidence interval [CI], 0.5-4.4; P=0.014 and for ≥2 crypts, β=3.0; 95% CI, 0.8-7.9; P=0.004). In combination with 3 other parameters: anterior mitral valve leaflet elongation (β=2.1; 95% CI, 1.7-3.1; P<0.001), abnormal LV apical trabeculae (β=1.6; 95% CI, 0.8-2.5; P<0.001), and smaller LV end-systolic volumes (β=1.4; 95% CI, 0.5-2.3; P=0.001), multiple crypts indicated the presence of sarcomere gene mutations with 80% accuracy and an area under the curve of 0.85 (95% CI, 0.8-0.9). In this G+LVH- population, cardiac myosin-binding protein C mutation carriers had twice the prevalence of crypts when compared with the other combined mutations (47 versus 23%; odds ratio, 2.9; 95% CI, 1.1-7.9; P=0.045).

Conclusions: The subclinical hypertrophic cardiomyopathy phenotype measured by cardiovascular magnetic resonance in a multicenter environment and consisting of crypts (particularly multiple), anterior mitral valve leaflet elongation, abnormal trabeculae, and smaller LV systolic cavity is indicative of the presence of sarcomere gene mutations and highlights the need for further study.

Keywords: cardiomyopathy, hypertrophic; genetics; magnetic resonance imaging.


Figures

Figure 1
Figure 1
A) Exact mathematical fractals (for example, the popular Mandelbrot set) are complex objects that show scaling self-similarity. Their complexity cannot be efficiently summarized using traditional Euclidean geometry. Fractal geometry is based on a mathematical construct and has the ability to measure complex objects. Real-world biology and some naturally-occurring images may also be complex and exhibit self-similarity within a finite range. As an illustration, perfect points have a TD of 0, straight lines or smooth regular curves have a TD of 1, flat planes have a TD of 2. Biological images tend to have non-linear features of dimension greater than 1: in this case endocardial contours may be regarded as non-linear quasi-fractal forms observed on the 2-dimensional imaging plane. Their FD is therefore any noninteger value between 1 and 2. B) Top row shows 3 exemplar slices from a G+LVH− with corresponding FD. Bottom row shows slices from a control. G+LVH− = genotype-positive, LVH-negative; FD = fractal dimension; TD = topological dimension.
Figure 2
Figure 2
Myocardial crypts (black carets) by cardiovascular magnetic resonance in the 24 carriers. Some had ≥ 1 additional crypt visible on a separate cine but single cines per participant are reproduced here. Views: * 4-chamber; ** left ventricular outflow tract; remainder are 2-chamber.
Figure 3
Figure 3
Bar chart comparing the prevalence of the 4 phenotypic abnormalities between controls, carriers bearing non-MYBPC3 mutations and carriers bearing the MYBPC3 mutation. AMVL = anterior mitral valve leaflet; LVESViR = left ventricular end-systolic volume adjusted for age, body surface area and gender; FDMaxApical = maximal apical fractal dimension; MYBPC3 = myosin-binding protein C, cardiac type; NS = not significant.
Figure 4
Figure 4
Simplified diagram depicting the major proteins of the thick and thin filaments and the distribution of sarcomere gene mutations expressed in our study population and reported here by DNA change and amino acid change nomenclature. For MYBPC3 only, mutation variants are mapped to individual domains that are displayed in a hypothetical arrangement extending from the thick to the thin filament. This figure is an adaptation of the illustration by Harris et al. with the permission of Wolters Kluwer Health). Key to transcript change per mutation variant: Blue border = missense mutations that cause single amino acid substitutions; Green border = insertions or deletions predicted to cause reading frame shifts (fs); Red border = nonsense mutations predicted to result in premature termination codons (ter); Pink borders = splice site donor/acceptor mutations. Key to mean crypt prevalence per mutation variant: Mutation fill colors are weighted across a spectrum from white (0 crypts) to deep burgundy (3 crypts). ACTC1 = actin, alpha cardiac muscle 1; MYH7 = myosin heavy chain, cardiac muscle beta isoform; MYL2 = myosin regulatory light chain 2, ventricular/cardiac muscle isoform; MYL3 = myosin light polypeptide 3; m = position of the MYBPC3 regulatory motif between domains C1 and C2; PA = proline/alanine-rich linker sequence between C0 and C1; TNNT2 = troponin T, cardiac muscle;TNNI3 = troponin I, cardiac muscle. Other abbreviations as in Figure 2.
Figure 5
Figure 5
A) The 4 cardiac structural and functional parameters shown to have significant independent association with the presence of sarcomere gene mutations in subclinical hypertrophic cardiomyopathy. B) Receiver operating characteristics (ROC) curve containing the 4 parameters and using as a reference, patient classification according to study criteria for inclusion of carriers and controls, showed an area under the curve (AUC) of 0.85. Diagonal reference line is also provided. C) In this case-control population we used a 2x2 contingency table to calculate the percentage of rulings that agreed with genetic diagnosis and obtained a sensitivity of 75% (95 % confidence intervals [CI] 64 – 84) and specificity, 84%, (95 % CI 73 - 91). Other abbreviations as in Figure 1.
Figure 5
Figure 5
A) The 4 cardiac structural and functional parameters shown to have significant independent association with the presence of sarcomere gene mutations in subclinical hypertrophic cardiomyopathy. B) Receiver operating characteristics (ROC) curve containing the 4 parameters and using as a reference, patient classification according to study criteria for inclusion of carriers and controls, showed an area under the curve (AUC) of 0.85. Diagonal reference line is also provided. C) In this case-control population we used a 2x2 contingency table to calculate the percentage of rulings that agreed with genetic diagnosis and obtained a sensitivity of 75% (95 % confidence intervals [CI] 64 – 84) and specificity, 84%, (95 % CI 73 - 91). Other abbreviations as in Figure 1.

References

    1. Maron BJ, Shirani J, Poliac LC, Mathenge R, Roberts WC, Mueller FO. Sudden death in young competitive athletes. Clinical, demographic, and pathological profiles. JAMA. 1996;276:199–204. - PubMed
    1. Maron BJ, Seidman JG, Seidman CE. Proposal for contemporary screening strategies in families with hypertrophic cardiomyopathy. J Am Coll Cardiol. 2004;44:2125–32. - PubMed
    1. Deva DP, Williams LK, Care M, Siminovitch KA, Moshonov H, Wintersperger BJ, Rakowski H, Crean AM. Deep basal inferoseptal crypts occur more commonly in patients with hypertrophic cardiomyopathy due to disease-causing myofilament mutations. Radiology. 2013;269:68–76. - PubMed
    1. Maron MS, Olivotto I, Harrigan C, Appelbaum E, Gibson CM, Lesser R, Haas TS, Udelson JE, Manning WJ, Maron BJ. Mitral valve abnormalities identified by cardiovascular magnetic resonance represent a primary phenotypic expression of hypertrophic cardiomyopathy. Circ. 2011;124:40–7. - PubMed
    1. Captur G, Lopes L, Patel V, Li C, Bassett P, Syrris P, Sado DM, Maestrini V, Mohun TJ, McKenna WJ, Muthurangu V, Elliott PM, Moon JC. Abnormal cardiac formation in hypertrophic cardiomyopathy - fractal analysis of trabeculae and preclinical gene expression. Circ Cardiovasc Genet. 2014;7:241–8. - PubMed

Publication types

MeSH terms

Substances

LinkOut - more resources