

Gene Expression Profiling of Valvular Interstitial Cells in Rapacz Familial Hypercholesterolemic Swine
- PMID: 25229013
- PMCID: PMC4163136
- DOI: 10.1016/j.gdata.2014.08.004
Gene Expression Profiling of Valvular Interstitial Cells in Rapacz Familial Hypercholesterolemic Swine
Abstract
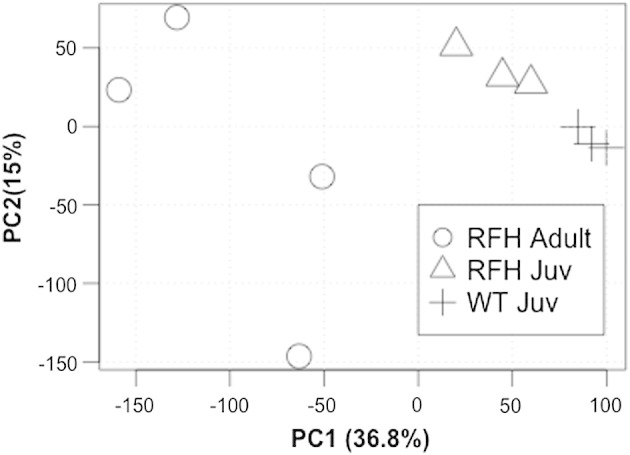
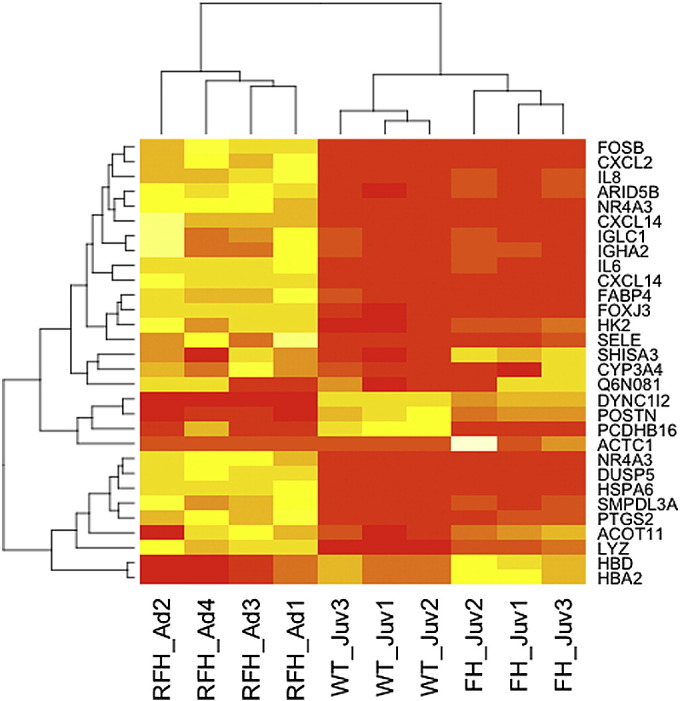
Rapacz familial hypercholesterolemic (RFH) swine are a well-established model of human FH, a highly prevalent hereditary disease associated with increased risk of coronary artery disease and calcific aortic valve disease (CAVD). However, while these animals have been used extensively for the study of atherosclerosis, the heart valves from RFH swine have not previously been examined. We report the analysis of valvular interstitial cell gene expression in adult (two year old) and juvenile (three months old) RFH and WT swine by microarray analysis via the Affymetrix Porcine Genome Array (GEO #: GSE53997). Principal component and hierarchical clustering analysis revealed grouping and almost no variability between the RFH juvenile and WT juvenile groups. Additionally, only 21 genes were found differentially expressed between these two experimental groups whereas over 900 genes were differentially expressed when comparing either RFH or WT juvenile swine to RFH adults.
Keywords: familial hypercholesterolemia; microarray; swine; valve disease.
Figures
Similar articles
-
Development of Aortic Valve Disease in Familial Hypercholesterolemic Swine: Implications for Elucidating Disease Etiology.J Am Heart Assoc. 2015 Oct 27;4(10):e002254. doi: 10.1161/JAHA.115.002254. J Am Heart Assoc. 2015. PMID: 26508741 Free PMC article.
-
Gene expression differences in healthy brachial and femoral arteries of Rapacz familial hypercholesterolemic swine.Physiol Genomics. 2011 Jun 28;43(12):781-8. doi: 10.1152/physiolgenomics.00151.2010. Epub 2011 Apr 19. Physiol Genomics. 2011. PMID: 21505098
-
Simulation of early calcific aortic valve disease in a 3D platform: A role for myofibroblast differentiation.J Mol Cell Cardiol. 2016 May;94:13-20. doi: 10.1016/j.yjmcc.2016.03.004. Epub 2016 Mar 17. J Mol Cell Cardiol. 2016. PMID: 26996755 Free PMC article.
-
Porcine models of accelerated coronary atherosclerosis: role of diabetes mellitus and hypercholesterolemia.J Diabetes Res. 2013;2013:761415. doi: 10.1155/2013/761415. Epub 2013 Jun 13. J Diabetes Res. 2013. PMID: 23844374 Free PMC article. Review.
-
Hypercholesterolemic valvulopathy: an aspect of malignant atherosclerosis.Ther Apher Dial. 2003 Aug;7(4):439-43. doi: 10.1046/j.1526-0968.2003.00075.x. Ther Apher Dial. 2003. PMID: 12887729 Review.
Cited by
-
Development of Aortic Valve Disease in Familial Hypercholesterolemic Swine: Implications for Elucidating Disease Etiology.J Am Heart Assoc. 2015 Oct 27;4(10):e002254. doi: 10.1161/JAHA.115.002254. J Am Heart Assoc. 2015. PMID: 26508741 Free PMC article.
-
Discovery of significant porcine SNPs for swine breed identification by a hybrid of information gain, genetic algorithm, and frequency feature selection technique.BMC Bioinformatics. 2020 May 26;21(1):216. doi: 10.1186/s12859-020-3471-4. BMC Bioinformatics. 2020. PMID: 32456608 Free PMC article.
-
Effect of Caloric Restriction on Metabolic Dysfunction of Young Rapacz Familial Hypercholesterolemic Swine (Sus scrofa).Comp Med. 2017 Dec 1;67(6):508-517. Comp Med. 2017. PMID: 29212583 Free PMC article.
References
-
- Gentleman R.C., Carey V.J., Bates D.M., Bolstad B., Dettling M., Dudoit S., Ellis B., Gautier L., Ge Y., Gentry J., Hornik K., Hothorn T., Huber W., Iacus S., Irizarry R., Leisch F., Li C., Maechler M., Rossini A.J., Sawitzki G., Smith C., Smyth G., Tierney L., Yang J.Y., Zhang J. Bioconductor: open software development for computational biology and bioinformatics. Genome Biol. 2004;5:R80. - PMC - PubMed
-
- Shakya K., Ruskin H.J., Kerr G., Crane M., Becker J. Comparison of microarray preprocessing methods. Adv. Exp. Med. Biol. 2010;680:139–147. - PubMed
-
- Tsai S., Cassady J.P., Freking B.A., Nonneman D.J., Rohrer G.A., Piedrahita J.A. Annotation of the affymetrix porcine genome microarray. Anim. Genet. 2006;37:423–424. - PubMed
-
- Smyth G.K. Linear models and empirical bayes methods for assessing differential expression in microarray experiments. Stat. Appl. Genet. Mol. Biol. 2004;3 (Article3Article3) - PubMed
Grants and funding
LinkOut - more resources
Full Text Sources
Other Literature Sources
Miscellaneous