Comparative Study
. 2014 Sep 30;5(18):8790-802.
doi: 10.18632/oncotarget.2405.

IsomiR expression profiles in human lymphoblastoid cell lines exhibit population and gender dependencies

Affiliations
Comparative Study

IsomiR expression profiles in human lymphoblastoid cell lines exhibit population and gender dependencies

Phillipe Loher et al. Oncotarget. .

Abstract

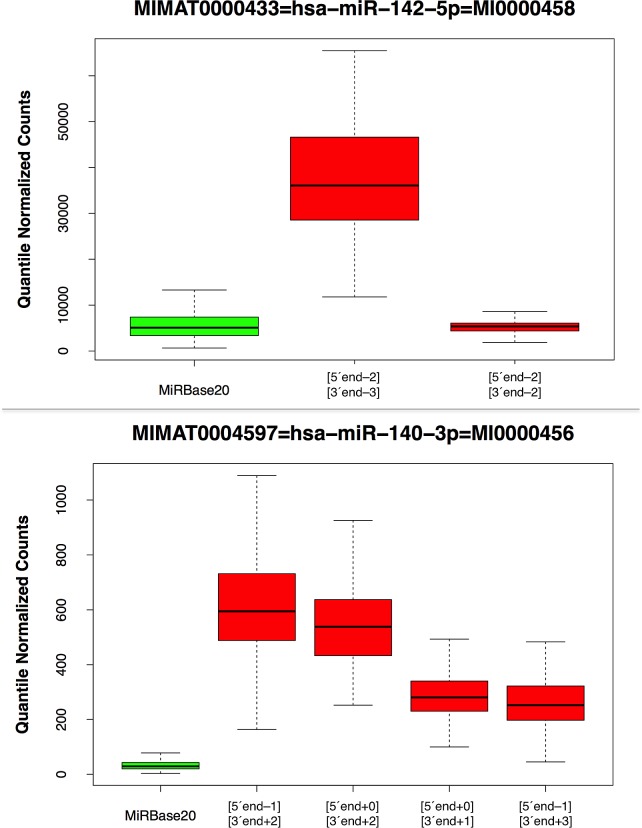
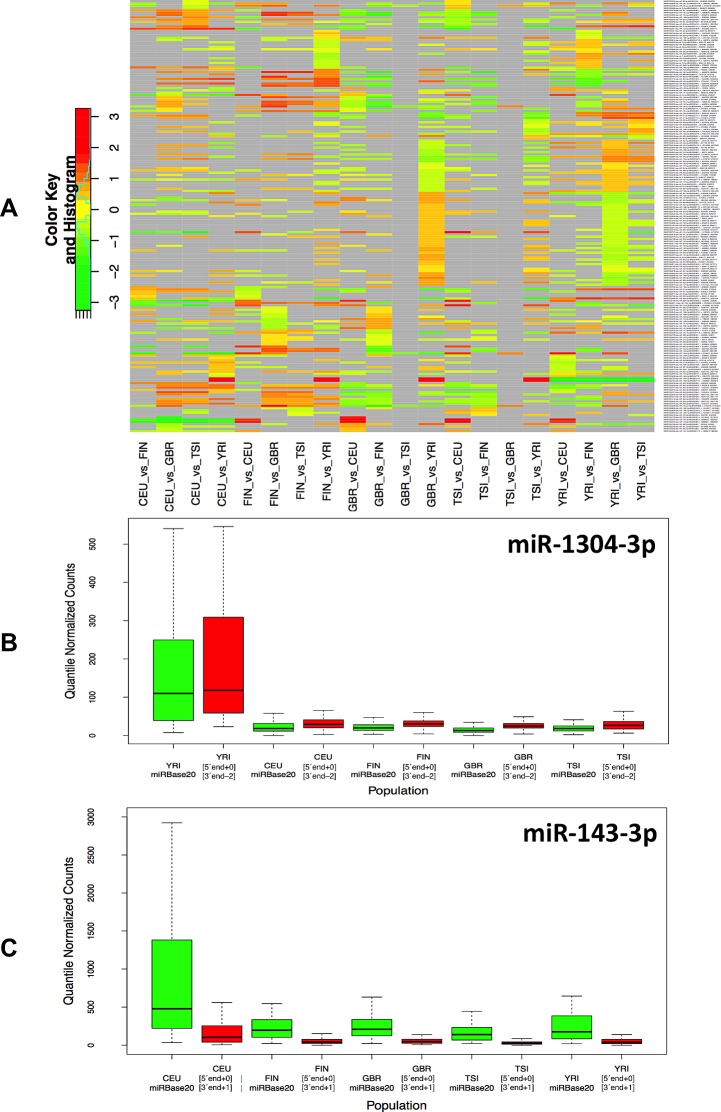
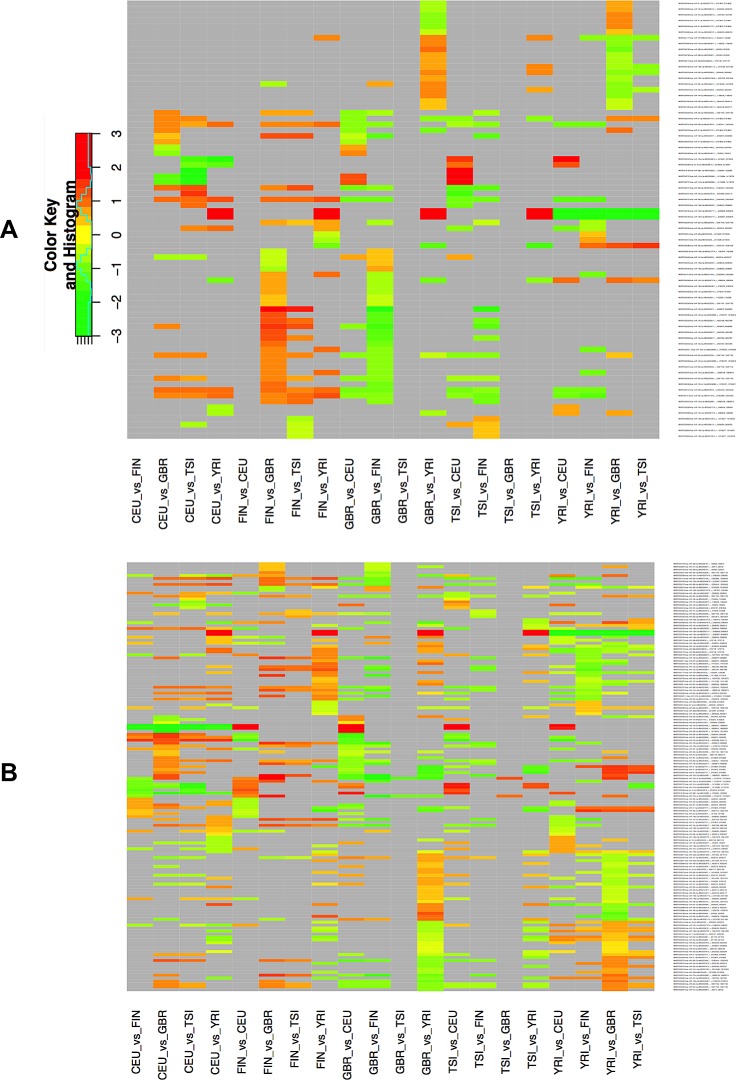
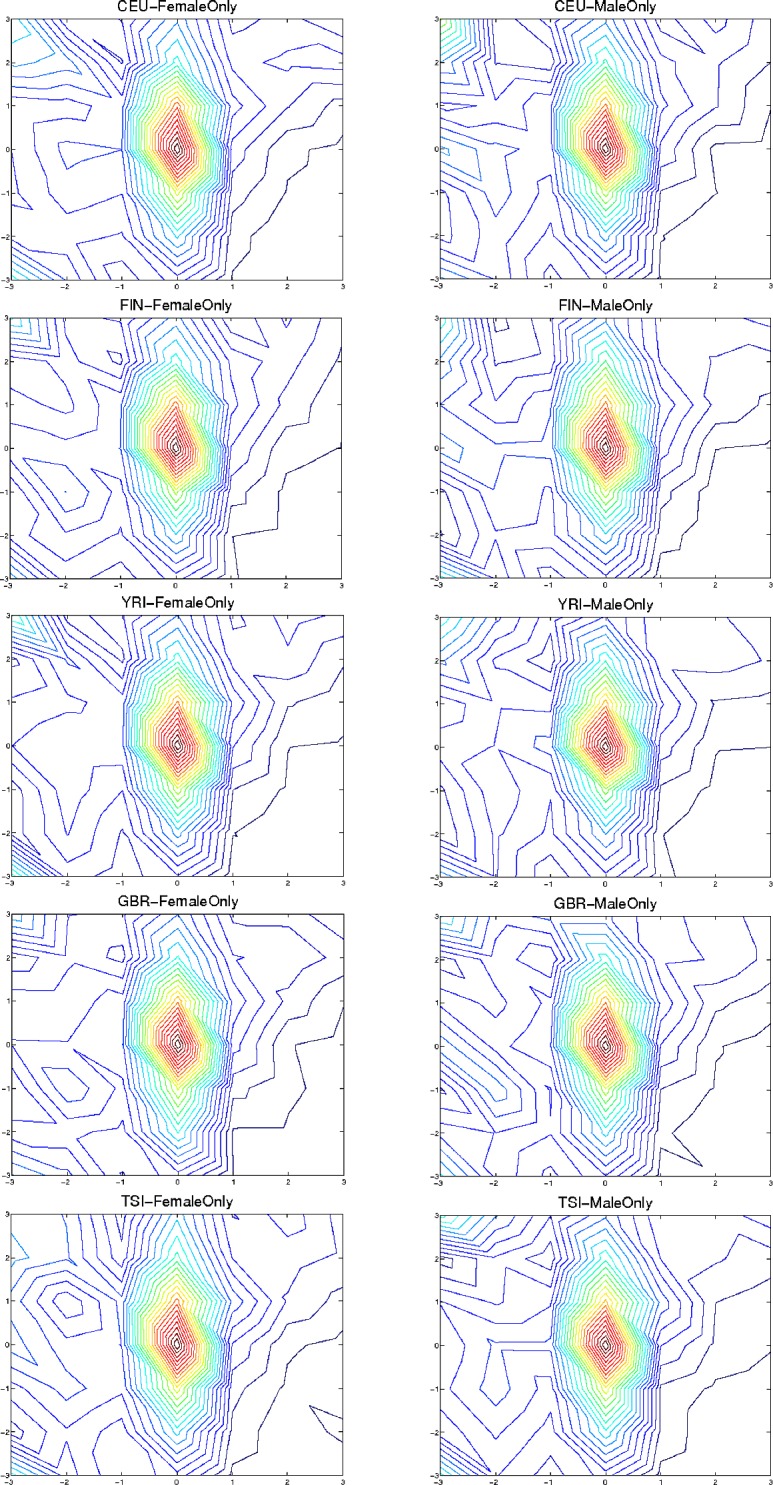
For many years it was believed that each mature microRNA (miRNA) existed as a single entity with fixed endpoints and a 'static' and unchangeable primary sequence. However, recent evidence suggests that mature miRNAs are more 'dynamic' and that each miRNA precursor arm gives rise to multiple isoforms, the isomiRs. Here we report on our identification of numerous and abundant isomiRs in the lymphoblastoid cell lines (LCLs) of 452 men and women from five different population groups. Unexpectedly, we find that these isomiRs exhibit an expression profile that is population-dependent and gender-dependent. This is important as it indicates that the LCLs of each gender/population combination have their own unique collection of mature miRNA transcripts. Moreover, each identified isomiR has its own characteristic abundance that remains consistent across biological replicates indicating that these are not degradation products. The primary sequences of identified isomiRs differ from the known miRBase miRNA either at their 5´-endpoint (leads to a different 'seed' sequence and suggests a different targetome), their 3´-endpoint, or both simultaneously. Our analysis of Argonaute PAR-CLIP data from LCLs supports the association of many of these newly identified isomiRs with the Argonaute silencing complex and thus their functional roles through participation in the RNA interference pathway.


Conflict of interest statement

Conflict financial Interests

The authors declare no competing financial interests.

Figures

Figure 1
Figure 1. MiRBase and isomiR boxplots
This Fig. shows boxplots for the miR-142-5p and miR-140-3p arms. The data was generated using the group of 452 unique samples (no technical replicates were included). The miRBase reference entry is shown in green whereas other detected isomiRs are shown in red. In the miR-142-5p case, the 5´ terminus of the first shown isomiR begins 2 positions before that of the miRBase reference whereas its 3´ terminus ends 3 positions before that of the miRBase reference. Analogously, in the miR-140-3p case, we identified 4 isomiRs whose 5´ and 3´ termini differ in various ways from those of the miRBase reference and whose abundance is consistently higher than the miRBase reference's.
Figure 2
Figure 2. Differential expression of isomiRs across populations
A: Using samples from both genders, we identified differentially expressed isomiRs separately for each pair of populations. This figure shows the resulting heat-map for the identified isomiRs. Cells shown in light gray correspond to cases that did not reach statistical significance for the corresponding isomiR/population combination. All other cells correspond to statistically significant combinations with an associated FDR value ≤ 0.05. The color intensity scale is logarithmic (log2 base). Note that the Fig. depicts redundant information in that all 5x4 population pairs are shown. B: This panel shows a boxplot for the miR-1304-3p arm within each of the five population groups (both genders): miR-1304-3p is more abundant in the YRI population. In particular, an isomiR variant that is 2 nts shorter on the 3´ end compared to the miRBase reference is also present in the YRI population and more abundant than the other variants. C: This panel shows a boxplot for the miR-143-3p arm within each of the five population groups (both genders): the reference miRBase entry and an isomiR variant that is longer on the 3´ end by 1 nt compared to the miRBase reference is more abundant in the CEU compared to the other four populations.
Figure 3
Figure 3. Differential expression of isomiRs across populations by gender
Using samples of the same gender, we identified differentially expressed isomiRs separately for each pair of populations. This figure shows the resulting heat-map for the identified isomiRs. Cells shown in light gray correspond to cases that did not reach statistical significance for the corresponding isomiR/population combination. All other cells correspond to statistically significant combinations with an associated FDR value ≤ 0.05. The color intensity scale is logarithmic (log2 base). A: Result from processing only the male samples. B: Result from processing only the female samples. Note that each panel depicts redundant information in that all 5x4 population pairs are shown.
Figure 4
Figure 4. Distribution of termini combination separately for each population and gender combination
Each isomiR is mapped to an (X, Y) point based on how its termini differ from those of the miRBase reference: negative (respectively positive) values indicate that the isomiR terminus is positioned to the left (respectively to the right) in the 5´→3´ direction of the corresponding terminus of the miRBase reference. The X-axis shows differences between the 5´ terminus of the isomiR compared to 5´ terminus of the corresponding miRBase entry. Analogously, the Y-axis shows differences between the 3´ terminus of the isomiR compared to the 3´ terminus of the corresponding miRBase entry. Within an arm, each isomiR's (X, Y) point has an associated height Z, whose value is between 0 and 1 and captures the isomiR's portion of the contribution to the reads that arise from the arm. The Figure shows the contours of the mesh formed by these points and separately for each of the 10 gender/population pairs: most of the isomiRs differ by +/- 1 nt at either the 5´ terminus or 3´ terminus, or both (see also Supp. Figure 5).

References

    1. Bartel DP. MicroRNAs: target recognition and regulatory functions. Cell. 2009;136(2):215–233. - PMC - PubMed
    1. Rigoutsos I, Tsirigos A. MicroRNA Target Prediction. In: Slack F, editor. MicroRNAs in Development and Cancer: Imperial College Press. 2010. pp. 237–259.
    1. Ling H, Fabbri M, Calin GA. MicroRNAs and other non-coding RNAs as targets for anticancer drug development. Nat Rev Drug Discov. 2013;12(11):847–865. - PMC - PubMed
    1. Garzon R, Marcucci G, Croce CM. Targeting microRNAs in cancer: rationale, strategies and challenges. Nat Rev Drug Discov. 2010;9(10):775–789. - PMC - PubMed
    1. Ebert MS, Sharp PA. Roles for MicroRNAs in Conferring Robustness to Biological Processes. Cell. 2012;149(3):515–524. - PMC - PubMed

Publication types

MeSH terms