. 2014 Dec;20(12):1045-55.
doi: 10.1111/cns.12325. Epub 2014 Sep 17.

BNIP3 interacting with LC3 triggers excessive mitophagy in delayed neuronal death in stroke

Affiliations

BNIP3 interacting with LC3 triggers excessive mitophagy in delayed neuronal death in stroke

Ruo-Yang Shi et al. CNS Neurosci Ther. 2014 Dec.

Abstract

Introduction: A basal level of mitophagy is essential in mitochondrial quality control in physiological conditions, while excessive mitophagy contributes to cell death in a number of diseases including ischemic stroke. Signals regulating this process remain unknown. BNIP3, a pro-apoptotic BH3-only protein, has been implicated as a regulator of mitophagy.

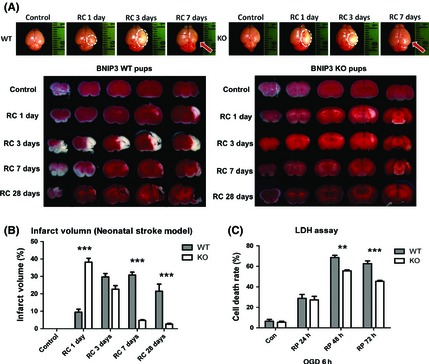
Aims: Both in vivo and in vitro models of stroke, as well as BNIP3 wild-type and knock out mice were used in this study.

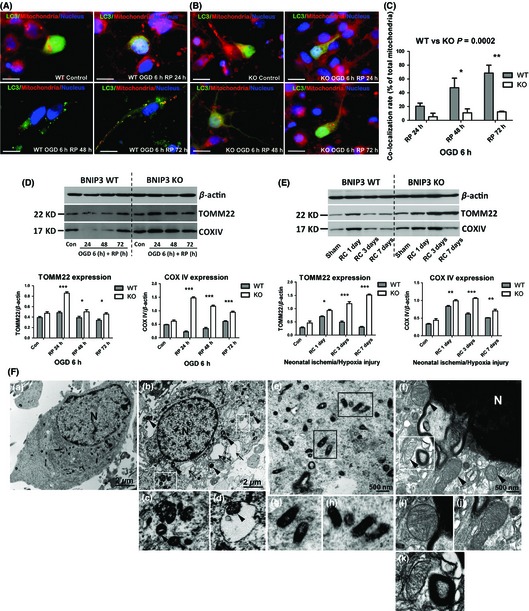
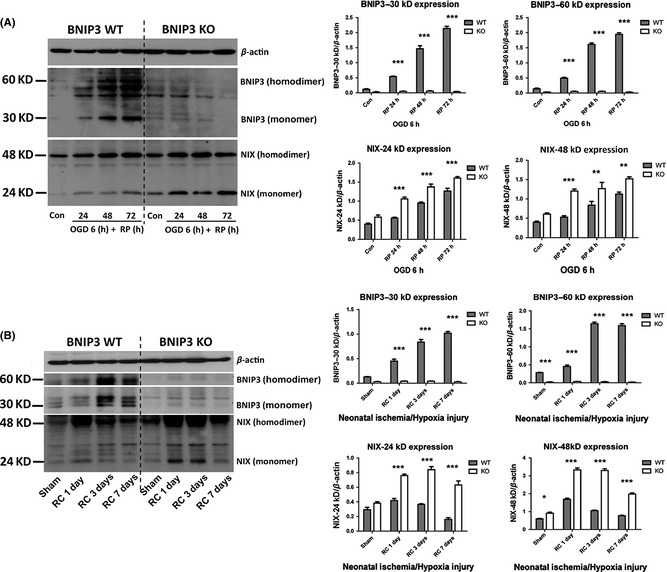
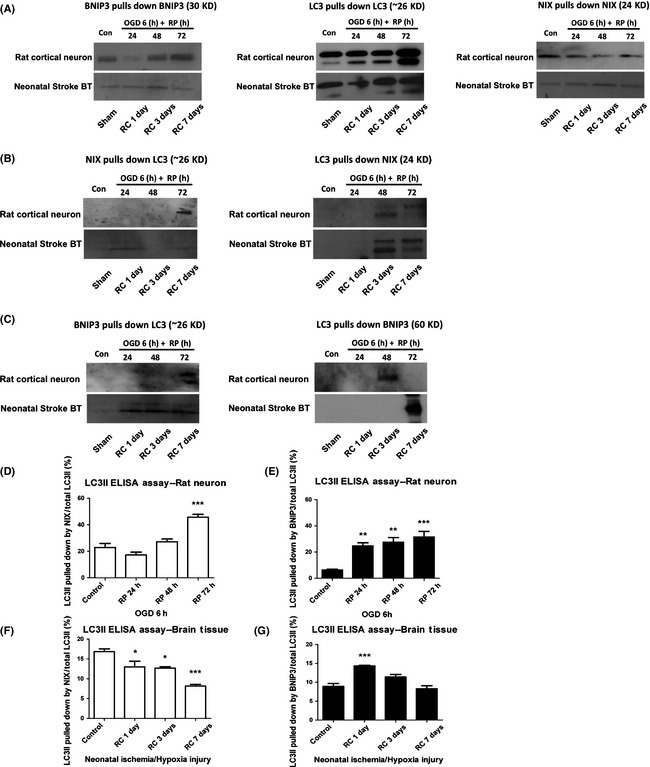
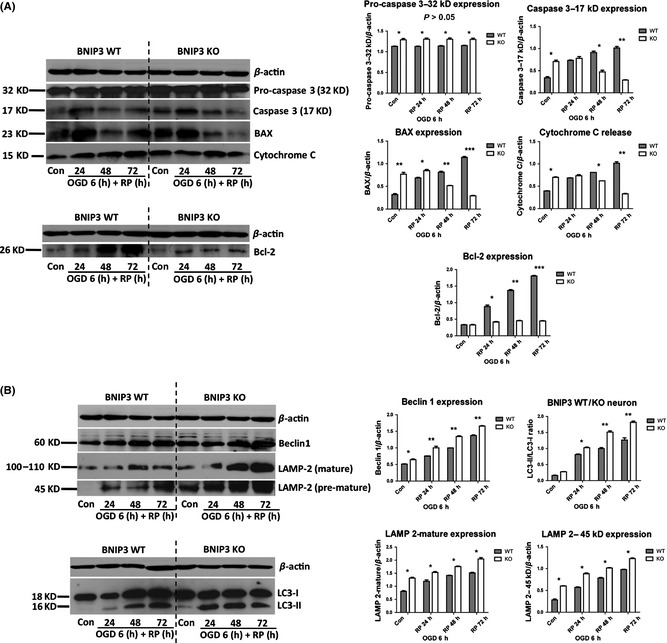
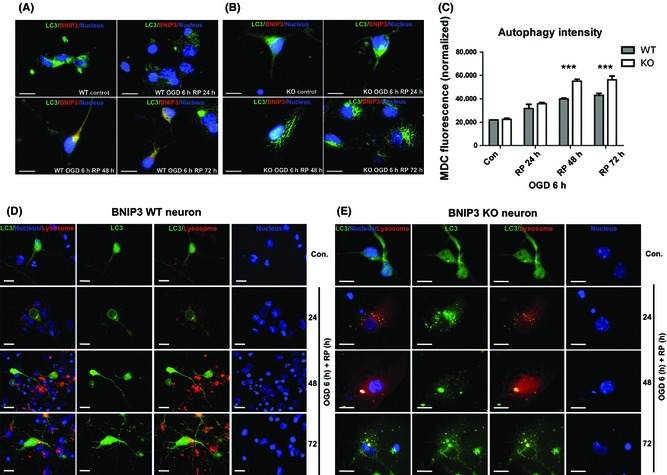
Results: We show that BNIP3 and its homologue BNIP3L (NIX) are highly expressed in a "delayed" manner and contribute to delayed neuronal loss following stroke. Deficiency in BNIP3 significantly decreases both neuronal mitophagy and apoptosis but increases nonselective autophagy following ischemic/hypoxic insults. The mitochondria-localized BNIP3 interacts with the autophagosome-localized LC3, suggesting that BNIP3, similar to NIX, functions as a LC3-binding receptor on mitochondria. Although NIX expression is upregulated when BNIP3 is silenced, up-regulation of NIX cannot functionally compensate for the loss of BNIP3 in activating excessive mitophagy.

Conclusions: NIX primarily regulates basal level of mitophagy in physiological conditions, whereas BNIP3 exclusively activates excessive mitophagy leading to cell death.

Keywords: BNIP3; LC3; Mitophagy; NIX; Neonatal stroke.


Conflict of interest statement

The authors declare no conflict of interest.

Figures

Figure 1
Figure 1
BNIP3 gene silencing was neuroprotective in stroke models. Measurement of brain infarct volume in BNIP3 WT and KO mice pups in neonatal stroke model. Two‐way ANOVA analysis and Bonferroni posttests were used to compare the total brain infarct volumes between the WT and KO groups: WT versus KO on each time point, ***< 0.001. Control groups were sham‐operated and were not subjected to I/H treatment. N = 3–6 for each group (A, B). Time course of cell death rate in OGD/RP‐challenged BNIP3 WT and KO neurons, quantified by LDH assay. Two‐way ANOVA analysis and Bonferroni posttests were used to compare the cell death rates between WT and KO groups: WT versus KO on each time point, **< 0.01, and ***< 0.001. Control group were without I/H. N = 3 for each group (C).
Figure 2
Figure 2
BNIP3 expression increased mitophagy in stroke models. Immunocytochemistry was used to detect mitophagy intensity in WT/KO neurons, as shown by co‐localization of mitochondria with autophagosomes. Mitochondria were stained with red, LC3 and nuclei were marked with green and blue, respectively. Scale bars = 30 μm. Images were taken at 63× objective (A, B). Co‐localization rates of mitochondria with autophagosomes in OGD/RP‐treated neurons were calculated. Two‐way ANOVA analysis and Bonferroni posttests were used to compare the WT and KO groups: WT versus KO on each time point, *< 0.05, **< 0.01, and ***< 0.001. N = 3 for each group (C). Western blot was used to determine the expression levels of mitochondrial marker proteins in vitro (D) and in vivo (E). β‐Actin (43 kDa) was included as internal control. Band densities were measured by Quantity One software. Two‐way ANOVA analysis and Bonferroni posttests were used to compare the WT and KO groups: WT versus KO on each time point, *< 0.05, **< 0.01, and ***< 0.001. Control groups were without I/H injury. N = 3 for each group. Group of electron micrographs (a–k) showed the occurrence of mitophagy in neurons after OGD/RP injury (F). White boxes highlight autophagosomes, black arrows indicate autophagic vacuoles, and black arrowheads indicate swelled and dilated mitochondria. Abundant double‐membrane autophagosomes formed in neurons after OGD 6 h plus RP 72 h treatment (bd, f and k, as indicated by white boxes). Healthy and functional mitochondria were stained darkened with normal sizes in control neurons (a, e, g, and h, as indicated by black boxes). Lysosome was activated and fused with autophagosome (f and k, as indicated inside the white box). N = nucleus; (c) and (d) showed the enlarged autophagosomes in (b); (g) and (h) showed the enlarged mitochondria with normal appearances in (e); (i) and (j) showed the enlarged mitochondria with swelling and dilation appearances in (f); (k) showed an enlarged autolysosome that encompassed an inside mitochondrion in (f), demonstrating the ongoing process of mitophagy. Scale bars = 2 μm in (a, b), Scale bars = 500 nm in (ef). N = 3 for each group.
Figure 3
Figure 3
Expression patterns of BNIP3 and NIX in stroke models. Primary cortical neurons were treated with OGD for 6 h followed by different times of reperfusion (24, 48, and 72 h). BNIP3 WT and KO mice pups were subjected to neonatal stroke modeling followed by recovery for 1, 3, or 7 days. Western blot was used to demonstrate the time course of BNIP3 and NIX expression in vitro (A) and in vivo (B). Band densities were measured by Quantity One software. Two‐way ANOVA analysis and Bonferroni posttests were used to compare the WT and KO groups: WT versus KO on each time point, *< 0.05, **< 0.01, and ***< 0.001. Controls were sham‐operated groups without I/H injury. N = 3 for each group.
Figure 4
Figure 4
Mitochondria‐localized BNIP3 interacted with LC3 in the neuronal mitophagy in stroke models. Protein–protein interactions between NIX and LC3, and BNIP3 and LC3 were confirmed by co‐IP in in vivo and in vitro stroke models, respectively (AC). Control groups verified the specificity and efficiency of each primary antibodies used in the co‐immunoprecipitation assays (A). Positive control group confirmed the interaction between NIX and LC3 in stroke models (B). Experimental group confirmed the interaction between BNIP3 (60 kDa homodimer form) and LC3 in stroke models (C). Using co‐IP followed by ELISA assays, the interactive activities between NIX and LC3, and BNIP3 and LC3 were further quantified at each time point (DG). One‐way ANOVA analysis and Dunnett's posttests were used for the statistical analysis. *< 0.05, **< 0.01, and ***< 0.001 versus control group. Control and sham‐operated groups were without I/H. N = 3 for each group.
Figure 5
Figure 5
BNIP3 gene silencing decreased apoptosis and increased general autophagy in cortical neurons after OGD/RP injury. Decreased apoptosis was quantified by the decreased expression of pro‐apoptotic proteins (caspase 3, BAX and cytochrome c) and anti‐apoptotic protein (Bcl‐2) in the BNIP3 KO neuron (A). Increased general autophagy was quantified by the increased expression of autophagy marker proteins (Beclin1, LAMP‐2, and LC3‐II/I ratio) in the BNIP3 KO neuron (B). β‐Actin (43 kDa) was included as internal control. Band densities were measured by Quantity One software. Two‐way ANOVA analysis and Bonferroni posttests were used to compare the WT and KO groups: WT versus KO on each time point, *< 0.05, **< 0.01, and ***< 0.001. N = 3 for each group.
Figure 6
Figure 6
BNIP3 gene silencing increased general autophagy in OGD/RP‐challenged neurons. Immunocytochemistry was used to demonstrate the expression of BNIP3 and processing and translocation (punctuate staining) of LC3 protein. BNIP3 was stained with red, and LC3 and nuclei were marked with green and blue, respectively. Scale bars = 30 μm. Images were taken at 63× objective (A, B). MDC fluorescence was measured to quantify the general autophagy intensities in BNIP3 WT and KO neurons. Two‐way ANOVA analysis and Bonferroni posttests were used to compare the WT and KO groups: WT versus KO on each time point, ***< 0.001. N = 3 for each group (C). Co‐localization of lysosomes with autophagosomes inside BNIP3 WT and KO neurons was detected. Lysosomes were stained with red, and LC3 and nuclei were marked with green and blue, respectively. Scale bars = 30 μm. Images were taken at 63× objective (D, E). Control groups without OGD/RP.

Similar articles

Cited by

References

    1. Youle RJ, Narendra DP. Mechanisms of mitophagy. Nat Rev Mol Cell Biol 2011;12:9–14. - PMC - PubMed
    1. Chu CT, Bayir H, Kagan VE. LC3 binds externalized cardiolipin on injured mitochondria to signal mitophagy in neurons: Implications for Parkinson disease. Autophagy, 2014;10:376–378. - PMC - PubMed
    1. Batlevi Y, La Spada AR. Mitochondrial autophagy in neural function, neurodegenerative disease, neuron cell death, and aging. Neurobiol Dis 2011;43:46–51. - PMC - PubMed
    1. Chakrabarti L, Eng J, Ivanov N, Garden GA, La Spada AR. Autophagy activation and enhanced mitophagy characterize the Purkinje cells of pcd mice prior to neuronal death. Mol Brain 2009;2:24. - PMC - PubMed
    1. Wong E, Cuervo AM. Autophagy gone awry in neurodegenerative diseases. Nat Neurosci 2010;13:805–811. - PMC - PubMed

Publication types

MeSH terms