Comparative Study
. 2014 Sep 18:7:654.
doi: 10.1186/1756-0500-7-654.

Implication of the cause of differences in 3D structures of proteins with high sequence identity based on analyses of amino acid sequences and 3D structures

Affiliations
Comparative Study

Implication of the cause of differences in 3D structures of proteins with high sequence identity based on analyses of amino acid sequences and 3D structures

Masanari Matsuoka et al. BMC Res Notes. .

Abstract

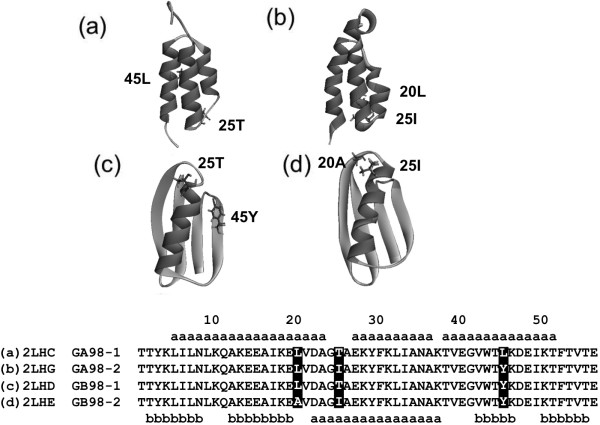
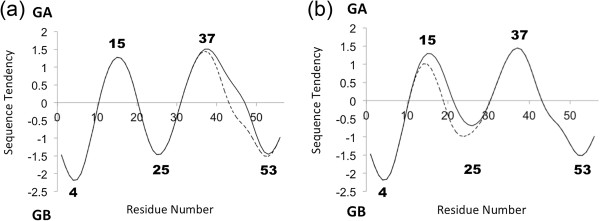
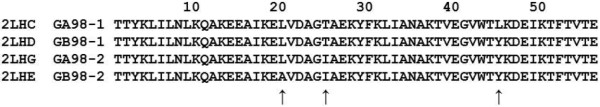
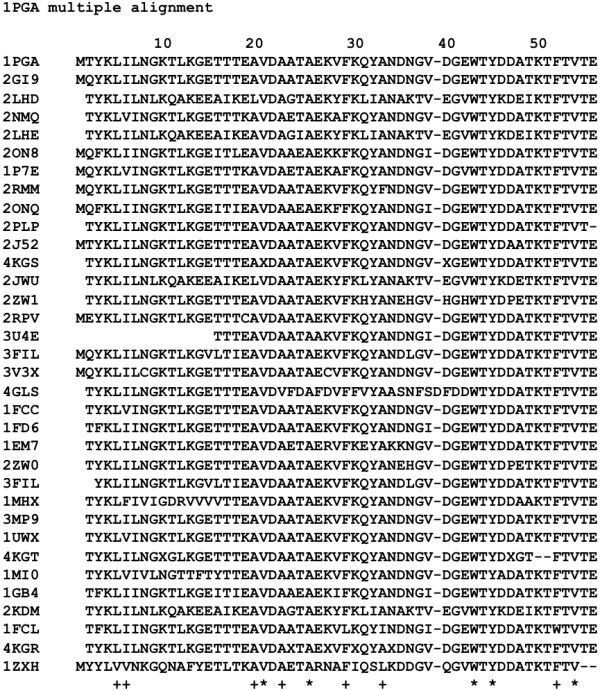
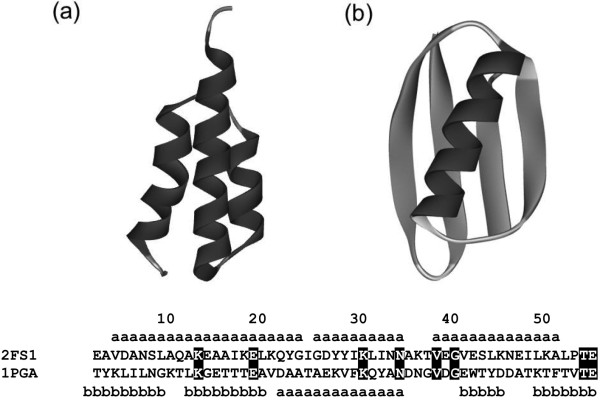
Background: Proteins that share a high sequence homology while exhibiting drastically different 3D structures are investigated in this study. Recently, artificial proteins related to the sequences of the GA and IgG binding GB domains of human serum albumin have been designed. These artificial proteins, referred to as GA and GB, share 98% amino acid sequence identity but exhibit different 3D structures, namely, a 3α bundle versus a 4β + α structure. Discriminating between their 3D structures based on their amino acid sequences is a very difficult problem. In the present work, in addition to using bioinformatics techniques, an analysis based on inter-residue average distance statistics is used to address this problem.

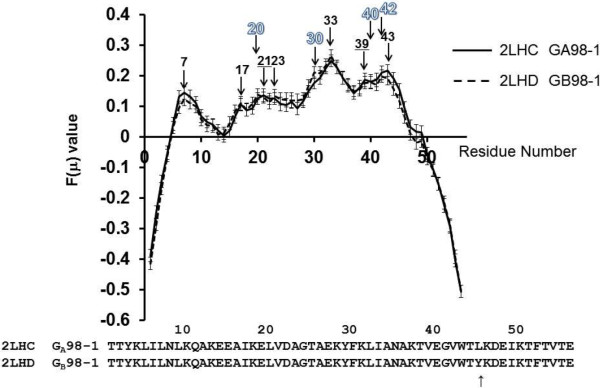
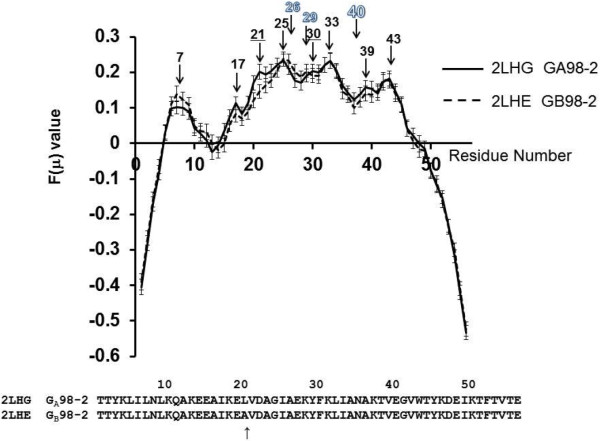
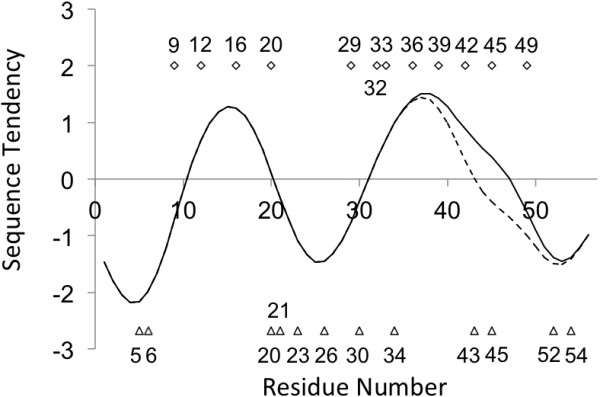
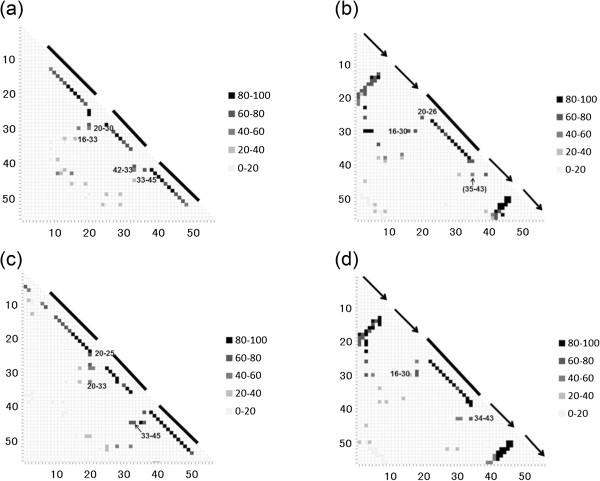
Results: It was hard to distinguish which structure a given sequence would take only with the results of ordinary analyses like BLAST and conservation analyses. However, in addition to these analyses, with the analysis based on the inter-residue average distance statistics and our sequence tendency analysis, we could infer which part would play an important role in its structural formation.

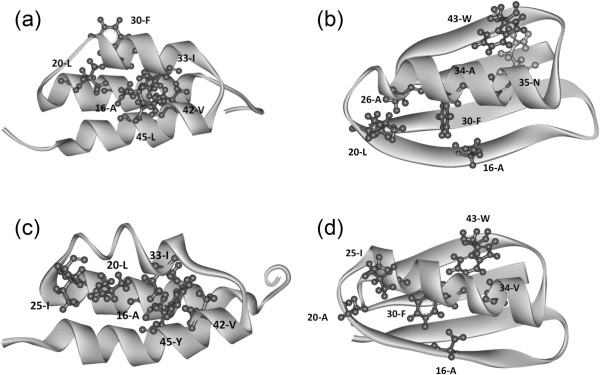
Conclusions: The results suggest possible determinants of the different 3D structures for sequences with high sequence identity. The possibility of discriminating between the 3D structures based on the given sequences is also discussed.


Figures

Figure 1
Figure 1
Ribbon representations of the 3D structures of 2LHC (a), 2LHG (b), 2LHD (c) and 2LHE (d) with their amino acid sequences. A segment with dark gray denotes an α helix and one with light gray denotes a β strand. The meanings of the symbols "a" and "b" are same as that in Figure  11. The differences between the sequences are highlighted and shown in stick in the figure above.
Figure 2
Figure 2
Plots of F(μ) values for 2LHC and 2LHD with error bars. An arrow with a numeral denotes the location of a peak of a plot. The numeral indicates the position of the residue at a peak. A black numeral, an underlined black numeral and an outlined numeral mean a peak observed in both 2LHC (GA98-1) and 2LHD (GB98-1), a peak observed in only 2LHC, and a peak observed in only 2LHD, respectively.
Figure 3
Figure 3
Plots of F(μ) values for 2LHG and 2LHE with error bars. An arrow with a numeral denotes the location of a peak of a plot. The numeral indicates the position of the residue at a peak. A black numeral, an underlined black numeral and an outlined numeral mean a peak observed in both 2LHG (GA98-2) and 2LHE (GB98-2), a peak observed in only 2LHG and a peak observed in only 2LHE, respectively.
Figure 4
Figure 4
Visuallization of hydrophobic packings. (a) The packing hydrophobic residues formed by residues near the peaks of the F-value plot for 2LHC (GA98-1). The packing residues are 16-A, 20-L, 30-F, 33-I, 42-V and 45-L. (b) The hydrophobic contacts formed by residues near the peaks of the F-value plot for 2LHD (GB98-1). The pairwise contacts are formed by 16-Ala and 30-Phe, 20-Leu and 26-Ala as well as by 34-Ala and 43-Trp. 35-Asn, which forms a contact with 43-Trp in Gō model simulations, is indicated by light gray. (c) The packing hydrophobic residues formed by residues near the peaks of the F-value plot for 2LHG (GA98-2). The packing residues are 16-A, 20-L,25-I, 33-I, 42-V and 45YL. (d) The hydrophobic contacts formed by residues near the peaks of the F-value plot for 2LHE (GB98-2). The pairwise contacts are formed by 16-Ala and 30-Phe, 20-Leu and 25-Ile as well as by 34-Ala and 43-Trp.
Figure 5
Figure 5
Sequence tendencies. (a) The solid or dashed line corresponds to [PDB:2LHC] (GA98-1) or [PDB:2LHD] (GB98-1), respectively. (b) The solid or dashed line corresponds to [PDB:2LHG] (GA98-2) or [PDB:2LHE] (GB98-2), respectively. While the x-axis denotes residue number, the y-axis denotes the relative similarity to 2FS1/1PGA. Positive or negative large value means the local sequence has high similarity to [PDB:2FS1] (GA) or [PDB:1PGA] (GB), respectively. The bold numbers represent the residue numbers at peaks or valleys of the plot. How we get the sequence tendencies is described in the Material and Methods section.
Figure 6
Figure 6
Distribution of conserved hydrophobic residues with local sequence tendencies. The solid or dashed line corresponds to the sequence tendency of GA98-1 or GB98-1, respectively. The squares above the sequence tendency plot denote the conserved hydrophobic residues of 2FS1 and its homologues (shown in Figure  8), while the triangles below the tendency plot denote these of 1PGA (shown in Figure  9).
Figure 7
Figure 7
Multiple alignment of 2LHC, 2LHD, 2LHG and 2LHE. The sites beside those marked by arrows are perfectly conserved.
Figure 8
Figure 8
Multiple alignment of sequences of 2FS1 and related proteins hit by BLAST. A site marked by "*" is perfectly conserved and that marked by "+" is 85% conserved.
Figure 9
Figure 9
Multiple alignment of sequences of 1PGA and related proteins hit by BLAST. A site marked by "*" is perfectly conserved and that marked by "+" is 85% conserved.
Figure 10
Figure 10
Contact map constructed from the conformation ensemble simulated by the present Gō model at around the transition state of folding. (a) 2LHC, (b) 2LHD, (c) 2LHG, and (d) 2LHE. A darker spot indicates the high occurrence of conformations with a contact corresponding to the spot. The numbers, for example "80-100", on the right side of the figure are the number of conformations during a simulation near the transition state. A black bar denotes the location of an α helix, and a black arrow indicates the location of a β strand.
Figure 11
Figure 11
Ribbon representations of the 3D structures of 2FS1 (a) and 1PGA(b) with their amino acid sequences. A segment with dark gray denotes an α helix and one with light gray denotes a β strand. A residue with the symbol "a" takes the α-helix conformation and one with "b" takes a β-strand conformation. The definition of the secondary structures in the PDB is used in this study. All identical residues between the two sequences are highlighted.
Figure 12
Figure 12
Cα-bead model of a protein used in this study. The bond length is fixed as 3.8 Å, and the bond and dihedral angle are symbolized as θ and ϕ, respectively.

Similar articles

Cited by

References

    1. Rost B. Twilight zone of protein sequence alignments. Protein Eng. 1999;12:85–94. doi: 10.1093/protein/12.2.85. - DOI - PubMed
    1. He Y, Rozak DA, Sari N, Chen Y, Bryan P, Orban J. Structure, dynamics, and stability variation in bacterial albumin binding modules: implications for species specificity. Biochemistry. 2006;45:10102–10109. doi: 10.1021/bi060409m. - DOI - PubMed
    1. He Y, Chen Y, Alexander PA, Bryan PN, Orban J. Mutational tipping points for switching protein folds and functions. Structure. 2012;20:283–291. doi: 10.1016/j.str.2011.11.018. - DOI - PMC - PubMed
    1. Shen Y, Bryan PN, He Y, Orban J, Baker D, Bax A. De novo structure generation using chemical shifts for proteins with high-sequence identity but different folds. Protein Sci. 2010;19:349–356. doi: 10.1002/pro.303. - DOI - PMC - PubMed
    1. Allison JR, Bergeler M, Hansen N, van Gunsteren WF. Current computer modeling cannot explain Why Two highly similar sequences fold into different structures. Biochemistry. 2011;50:10965–10973. doi: 10.1021/bi2015663. - DOI - PubMed

Publication types