. 2014 Nov 20;515(7527):423-6.
doi: 10.1038/nature13738. Epub 2014 Sep 17.

Members of the human gut microbiota involved in recovery from Vibrio cholerae infection

Affiliations

Members of the human gut microbiota involved in recovery from Vibrio cholerae infection

Ansel Hsiao et al. Nature. .

Abstract

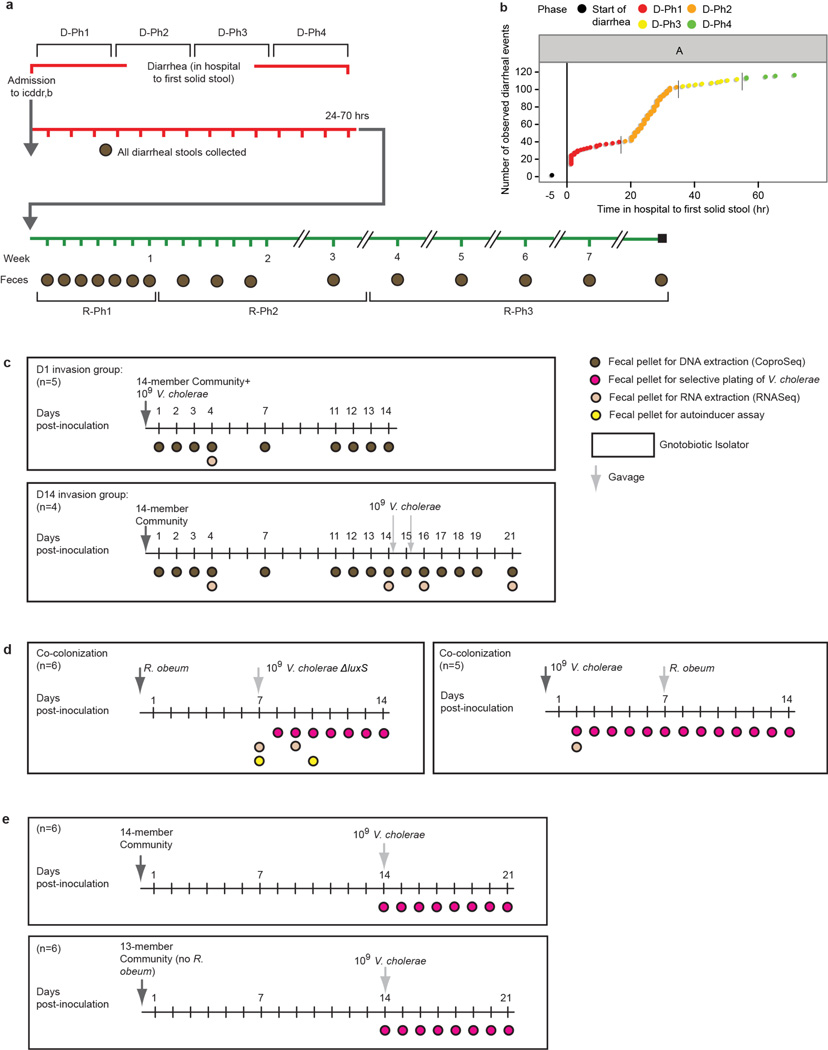
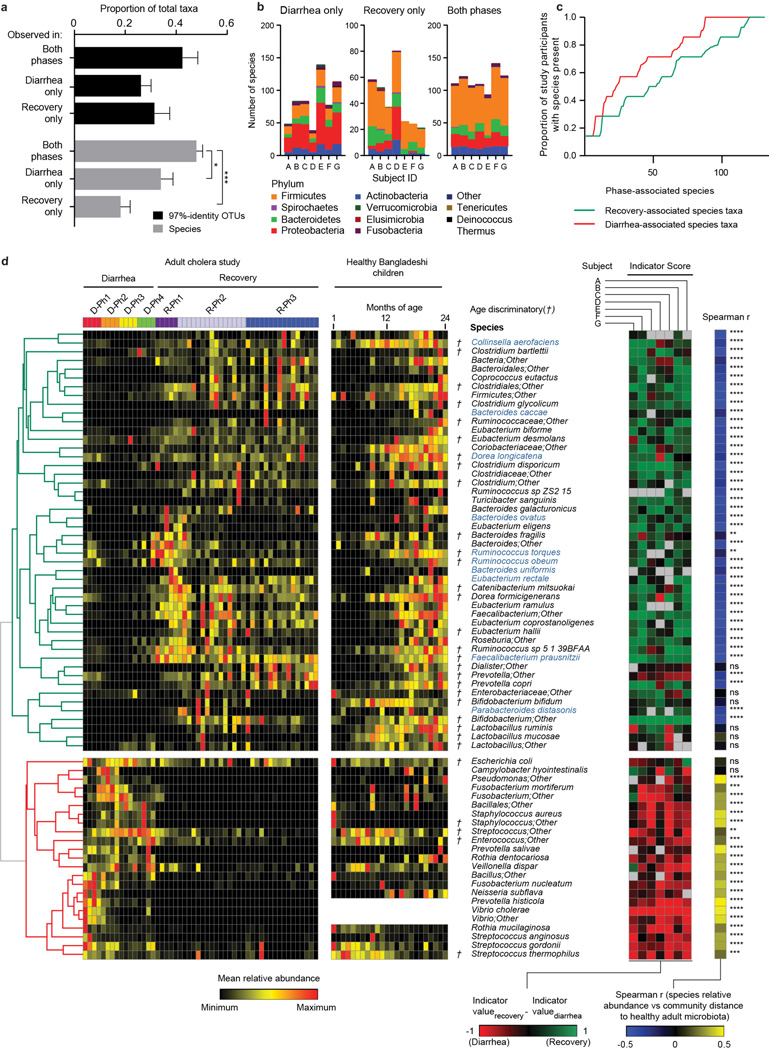
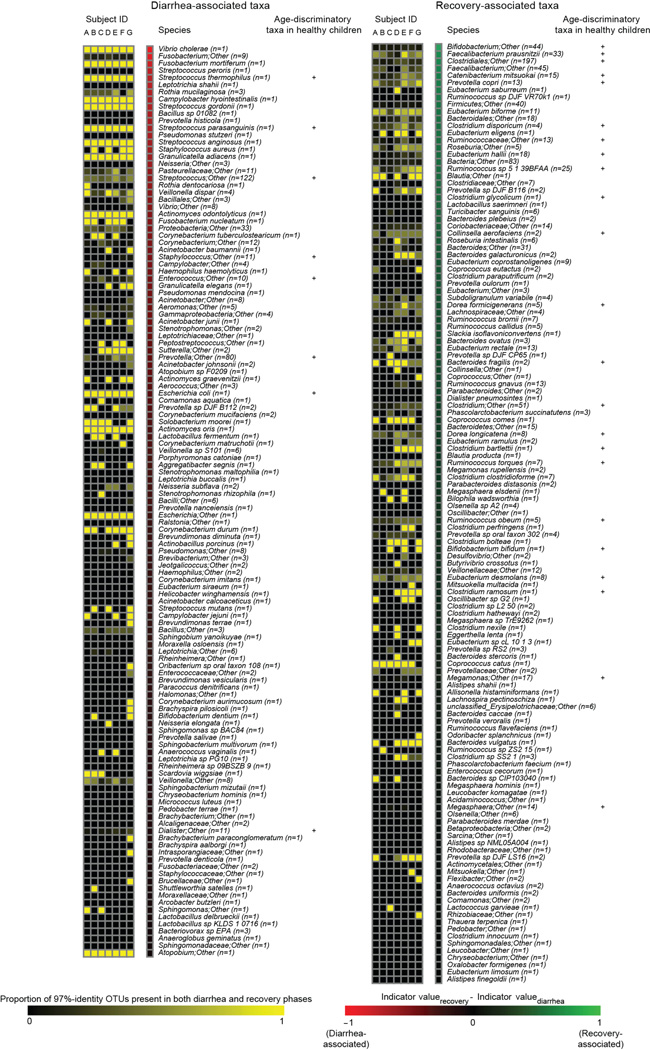
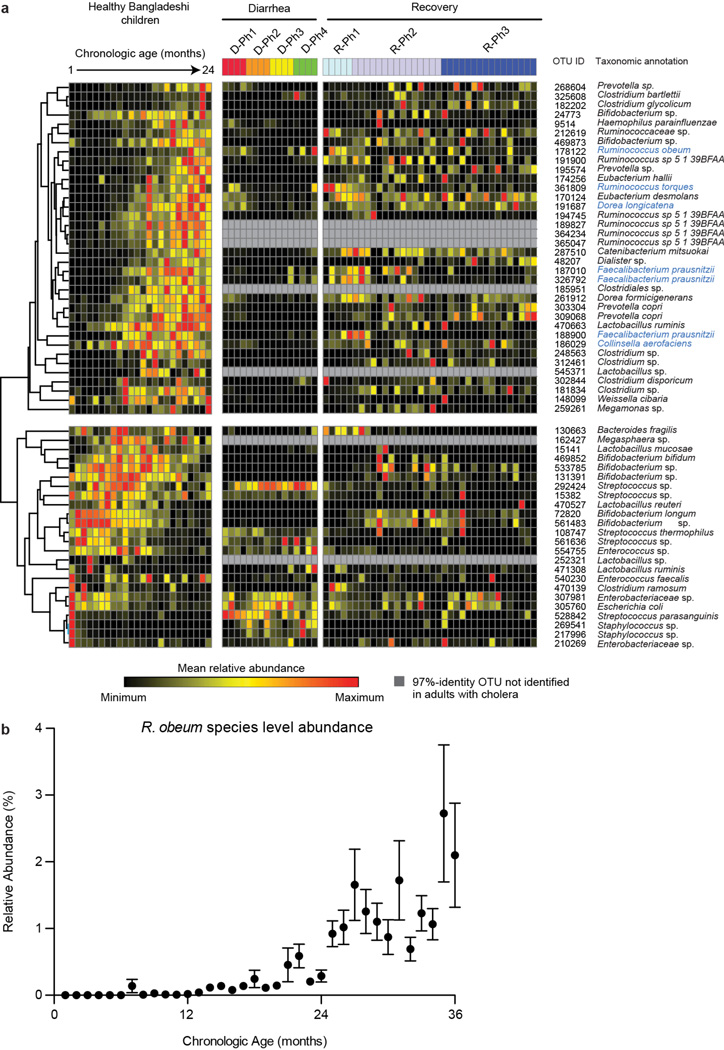
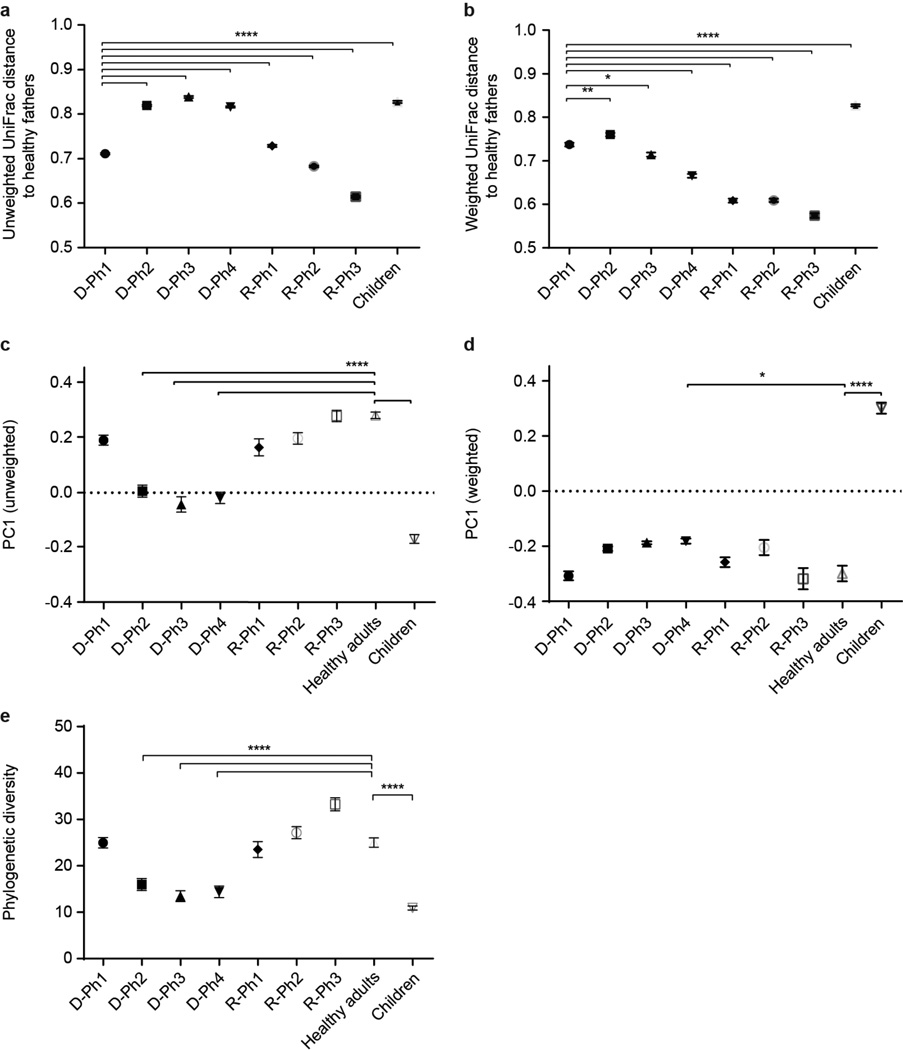
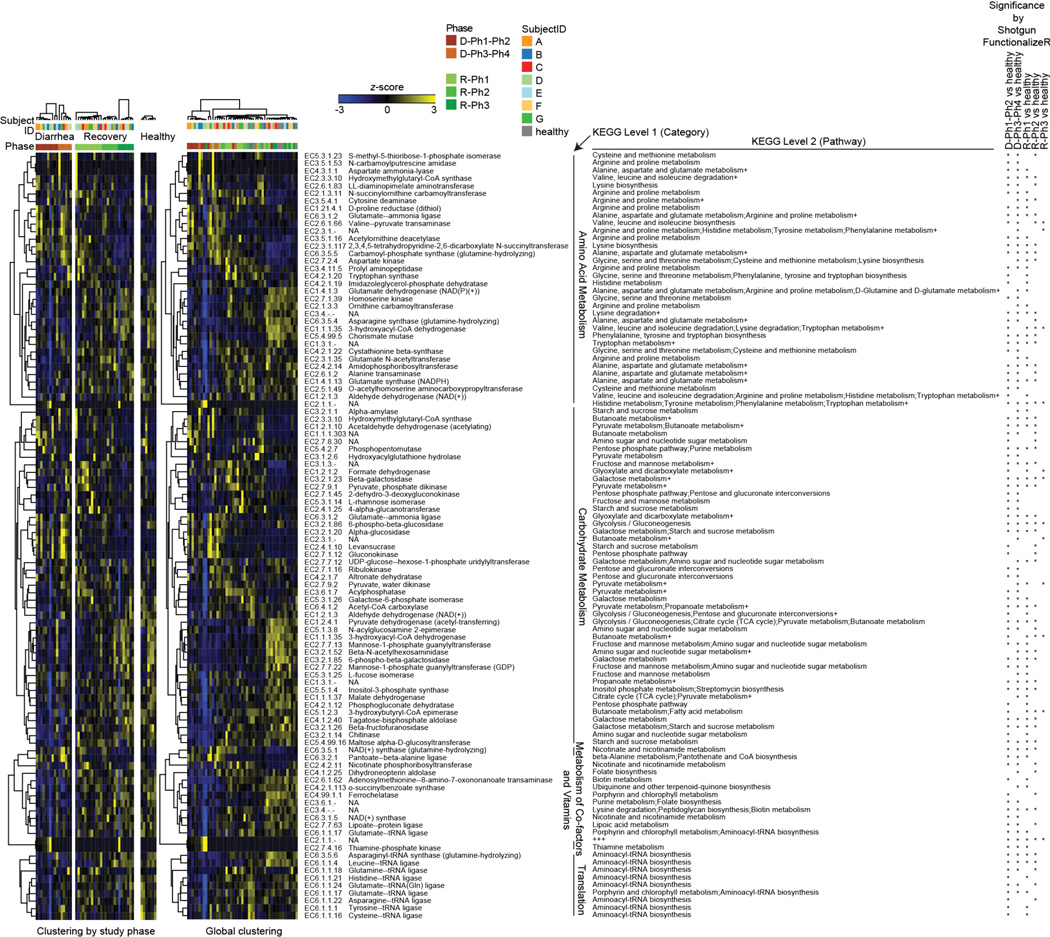
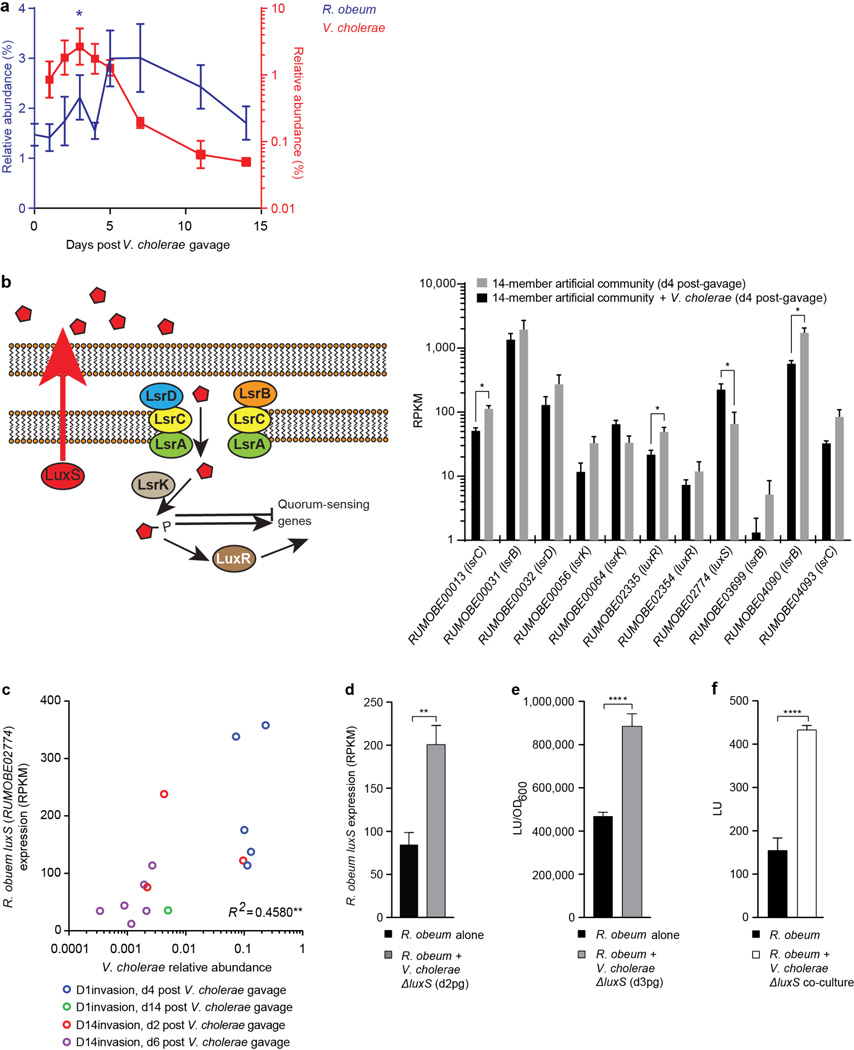
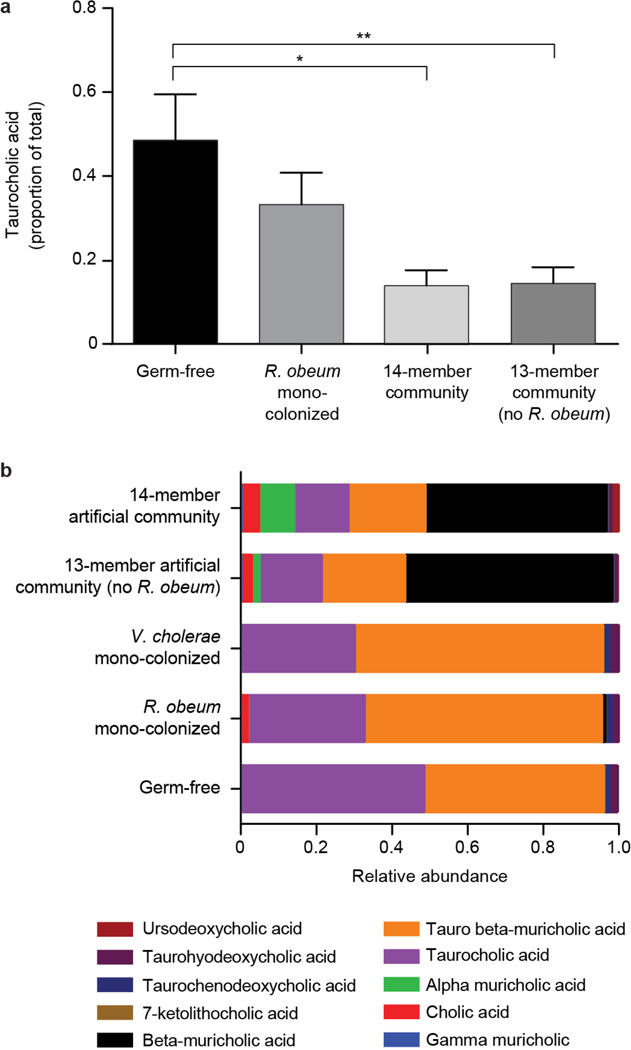
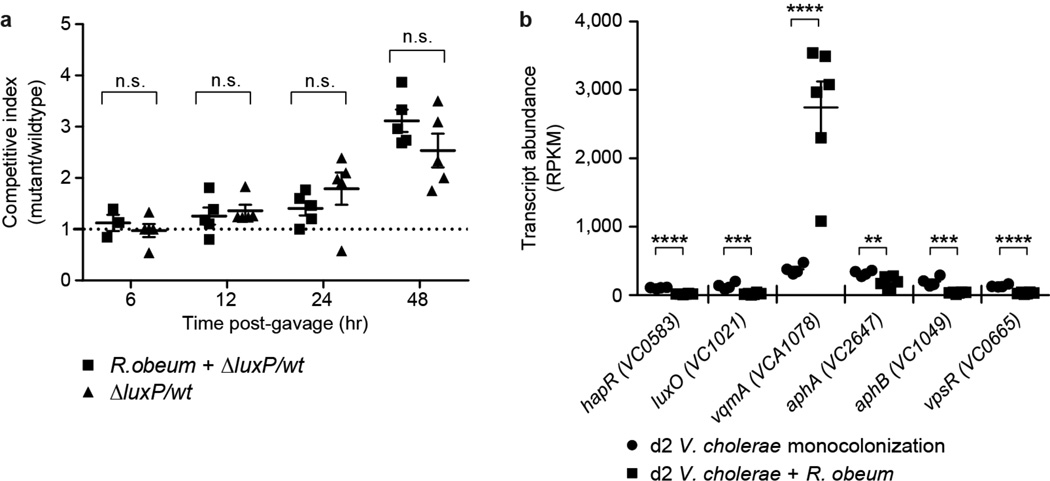
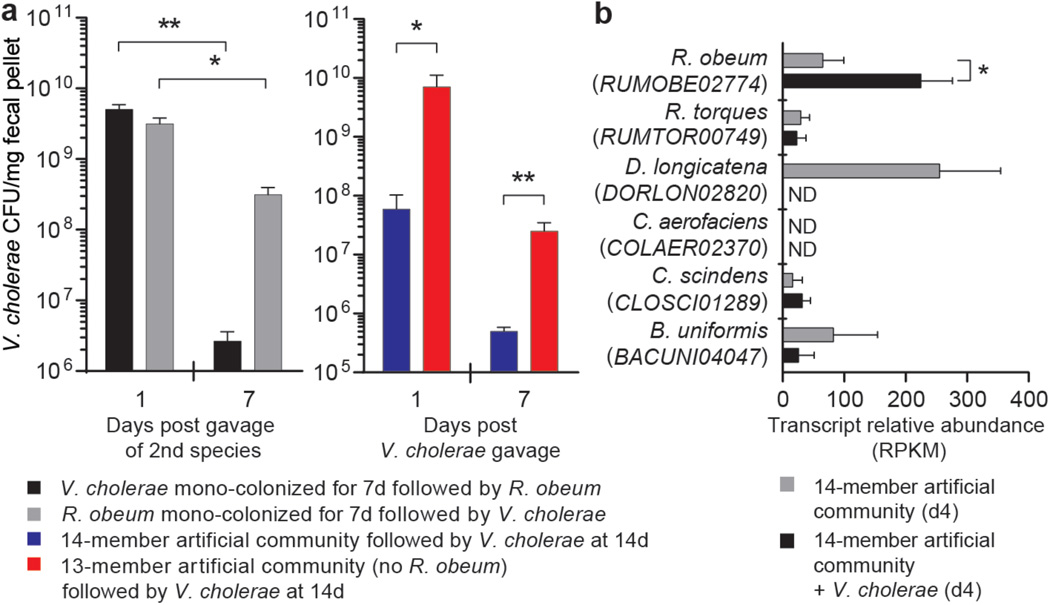
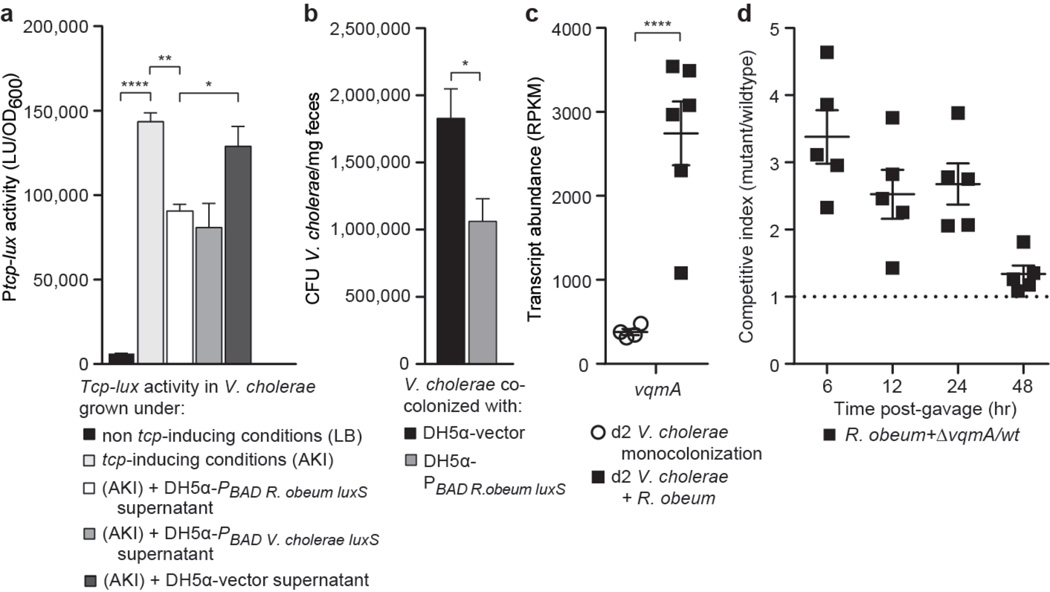
Given the global burden of diarrhoeal diseases, it is important to understand how members of the gut microbiota affect the risk for, course of, and recovery from disease in children and adults. The acute, voluminous diarrhoea caused by Vibrio cholerae represents a dramatic example of enteropathogen invasion and gut microbial community disruption. Here we conduct a detailed time-series metagenomic study of faecal microbiota collected during the acute diarrhoeal and recovery phases of cholera in a cohort of Bangladeshi adults living in an area with a high burden of disease. We find that recovery is characterized by a pattern of accumulation of bacterial taxa that shows similarities to the pattern of assembly/maturation of the gut microbiota in healthy Bangladeshi children. To define the underlying mechanisms, we introduce into gnotobiotic mice an artificial community composed of human gut bacterial species that directly correlate with recovery from cholera in adults and are indicative of normal microbiota maturation in healthy Bangladeshi children. One of the species, Ruminococcus obeum, exhibits consistent increases in its relative abundance upon V. cholerae infection of the mice. Follow-up analyses, including mono- and co-colonization studies, establish that R. obeum restricts V. cholerae colonization, that R. obeum luxS (autoinducer-2 (AI-2) synthase) expression and AI-2 production increase significantly with V. cholerae invasion, and that R. obeum AI-2 causes quorum-sensing-mediated repression of several V. cholerae colonization factors. Co-colonization with V. cholerae mutants discloses that R. obeum AI-2 reduces Vibrio colonization/pathogenicity through a novel pathway that does not depend on the V. cholerae AI-2 sensor, LuxP. The approach described can be used to mine the gut microbiota of Bangladeshi or other populations for members that use autoinducers and/or other mechanisms to limit colonization with V. cholerae, or conceivably other enteropathogens.


Figures

Extended Data Figure 1
Extended Data Figure 1. Experimental designs for clinical study and gnotobiotic mouse experiments
(a) Sampling schedule for human cholera study. (b) Frequency of diarrheal episodes over time for representative participant (subject A). Initial time (black circle) represents beginning of diarrhea. The long vertical line marks enrollment into the study. Colors and short vertical lines denote boundaries of study phases defined in panel a. (c–e) Gnotobiotic mouse experimental design. The number (n) of animals in each treatment group is shown.
Extended Data Figure 2
Extended Data Figure 2. Bacterial taxa associated with diarrheal and recovery phase
(a) Proportion of bacterial species-level taxa that were observed in both diarrhea and recovery phases, in D-Ph1 to D-Ph4 only, and in R-Ph1 to R-Ph3 only. Mean values ± SEM are plotted. *, P<0.05, ***, P<0.001 (unpaired Mann-Whitney test). (b) Phylum level analysis. Mean values are plotted. (c) Proportion of study participants having bacterial taxa associated by indicator species analysis with the diarrhea or recovery phase. The x-axis shows species associated with each phase, ranked by proportion of subjects harboring that species. For each species, ‘representation in study participants’ is the average presence/absence of all 97%-identity OTUs with that species taxonomic assignment. The OTU table was rarefied to 49,000 reads per sample. (d) Shown are bacterial species identified by indicator analysis as indicative of diarrhea or recovery phases in adult cholera patients, and species identified by Random Forests analysis as discriminatory for different stages in the maturation of the gut microbiota of healthy Bangladesh infants/children aged 1–24 months (denoted by the symbol †). The heatmap in the left hand portion of the panel shows mean relative abundances of species across all individuals during D-Ph1 to D-Ph4, with each phase subdivided into four equal time bins. For recovery timepoints, columns represent the mean relative abundances for each sampling timepoint during R-Ph1 to R-Ph3. Mean relative abundance values are also presented for these same species in the fecal microbiota of 50 healthy Bangladeshi children sampled from 1–2 years of age at monthly intervals. Unsupervised hierarchical clustering was performed based on relative abundances of species in the fecal microbiota of the patients with cholera. The green portion of the tree encompasses species that are more abundant during recovery while the red portion encompasses species that are more abundant during diarrhea. Indicator scores are presented in the right hand portion of the panel, with ‘score’ for a given taxon defined as its indicator value for recovery minus its indicator value for diarrhea (−1, highly diarrhea-associated; +1, highly recovery associated). Spearman rank correlation coefficients of mean species relative abundance by sample in the cholera study versus mean sample weighted UniFrac distance to healthy adult fecal microbiota are shown at the extreme right together with the statistical significance of correlations after Benjamini-Hochberg FDR correction for multiple hypothesis testing (n.s., not significant; *, P<0.05; **, P<0.01; ***, P<0.001). Higher coefficients indicate increasing divergence from a healthy configuration with higher relative abundance of a given species. Species shown satisfied two or more of the following criteria: (i) presence among the list of the top 40 age-discriminatory species in the Random Forests-based model of microbiota maturation in healthy infants and children; (ii) indicator value score >0.7; (iii) significant correlation (Spearman r) between relative abundance in the microbiota of cholera patients and UniFrac distance to healthy adult microbiota; and (iv) were included in the artificial 14-member human gut community (species name highlighted in blue).
Extended Data Figure 3
Extended Data Figure 3. 97%-identity OTUs observed in both diarrhea and recovery phases
The proportion of 97%-identity OTUs with a given species-level taxonomic assignment that were present in both diarrhea and recovery phases is shown for each individual in the study. The number of 97%-identity OTUs with a given species assignment is shown in parentheses. Species are ordered based on their indicator scores (indicator valuerecovery minus indicator valuediarrhea). Age-discriminatory bacterial species incorporated into a Random Forests-based model for defining relative microbiota maturity and microbiota-for-age Z scores in healthy Bangladeshi infants and children are marked with a “+”. 97%-identity OTUs were derived from datasets generated from all adult cholera patient samples; the OTU table was rarefied to 49,000 reads per sample.
Extended Data Figure 4
Extended Data Figure 4. Pattern of appearance of age-discriminatory 97%-identity OTUs in the fecal microbiota of patients with cholera mirrors the normal age-dependent pattern in the fecal microbiota of healthy Bangladeshi infants and children
(a) Left portion of panel shows hierarchical clustering of relative abundance values for each of the top 60 most age-discriminatory 97%-identity OTUs in a Random Forests-based model of normal maturation of the microbiota in healthy Bangladeshi infants/children (importance scores for the age-discriminatory taxa defined by Random Forests analysis are reported in ref. 3; these 60 97%-identity OTUs can be grouped into 40 species-level taxa). Right portion of panel presents the mean relative abundances of these OTUs in samples obtained from cholera patients during D-Ph1 to D-Ph4, and R-Ph1 to R-Ph3. 97%-identity OTUs corresponding to species included in the artificial community that was introduced into gnotobiotic mice are highlighted in blue. (b) Relative abundance of R. obeum species in the fecal microbiota of healthy Bangladeshi children sampled monthly through the first three years of life. Mean values±SEM are plotted.
Extended Data Figure 5
Extended Data Figure 5. Pattern of recovery of the gut microbiota of cholera patients
(a,b) Mean unweighted (a) and weighted (b) UniFrac distances to healthy adult controls at each of the defined phases of diarrhea and recovery. (c,d) Principal coordinates analysis (PCoA) of UniFrac distances between gut microbiota samples. Location along the principal axis of variation (PC1) shows how acute diarrheal communities first resemble those of healthy Bangladeshi children sampled during the first two years of life, then evolve their phylogenetic configurations during the recovery phase towards those of healthy Bangladeshi adults. PC1 accounts for 34.3% variation for weighted and 17.7% variation for unweighted UniFrac values. (e) Alpha diversity (whole-tree phylogenetic diversity) measurements of fecal microbial communities through all study phases. Mean values±SEM are plotted. *, P<0.05, **, P<0.01, ****, P<0.0001 (Kruskal-Wallis ANOVA followed by multiple comparisons test).
Extended Data Figure 6
Extended Data Figure 6. Proportional representation of genes encoding ECs in fecal microbiomes sampled during the diarrheal and recovery phases of cholera
Shotgun sequencing of fecal community DNA was performed [MiSeq 2000 instrument; 2×250bp paired-end reads; 341,701±145,681 reads (mean ± SD/sample)]. Read pairs were assembled (SHERA software package). Read counts were collapsed based on their assignment to Enzyme Commissions number identifiers (ECs). The significance of differences in EC abundances compared to fecal microbiomes in healthy adult Bangladeshi controls was defined using ShotgunFunctionalizeR. Unsupervised hierarchical clustering identifies groups of ECs that characterize the fecal microbiomes of cholera patients at varying phases of diarrhea and recovery. The heatmap on the left shows the results of EC clustering by phase (diarrhea/recovery). An asterisk on the extreme right of the figure indicates that EC abundance differences observed across the specified study phases were statistically significant (adjusted P<0.00001, ShotgunFunctionalizeR). The heatmap on the right presents the results of a global clustering of all time-points and study phases. 102 ECs were identified with (i) at least 0.1% average relative abundance across the study, and (ii) significant differences in their representation relative to healthy microbiomes in at least one comparison (adjusted P<0.00001 based on ShotgunFunctionalizeR). In each of the heatmaps, Z-scores for each EC across all samples are plotted. ECs are grouped by KEGG Level 1 assignment and further annotated based on their KEGG Pathway assignments. A ‘+’ indicates that the EC has additional KEGG Level 2 annotations (see Supplementary Table 8 for a list of all assignable functional annotations). Note that the majority of the 46 ECs that were more abundant during diarrhea phases in study participants are related to carbohydrate metabolism. The fecal microbiomes of patients during recovery are enriched for genes involved in vitamin and co-factor metabolism (Supplementary Table 8).
Extended Data Figure 7
Extended Data Figure 7. R. obeum encodes a functional AI-2 system and R. obeum AI-2 production is stimulated by the presence of V. cholerae
(a) Relative abundances of R. obeum and V. cholerae in the fecal microbiota after introduction of V. cholerae into mice harboring the artificial 14-member human gut community (D14invasion group, see Extended Data Figure 1c). ‘Days post gavage’ refers to the second of two daily gavages of 109 CFU V. cholerae into animals that had been colonized 14 days earlier with the 14-member community. Mean values±SEM are shown (n=4–5 mice, *, P<0.05, unpaired Student’s test). (b) Left portion of the panel shows AI-2 signaling pathway components represented in the R. obeum genome (left panel). Right portion plots changes in expression of these components as defined by microbial RNA-Seq of fecal microbiota samples obtained (i) 4 days after colonization of mice with the 14-member community and (ii) 4 days after gavage of mice with the 14-member community together with 109 CFU of V. cholerae (n=4–6 animals/group; one fecal sample analyzed/animal). Mean values±SEM are shown. *, P<0.05 (Mann-Whitney U test). (c) RNA-Seq of fecal samples collected at the time points and treatment groups indicated reveals that R. obeum luxS transcription is directly correlated to V. cholerae abundance in the context of the 14-member community. **P<0.01 (F test) (d) R. obeum luxS expression. Mice were colonized first with R. obeum for 7 day. Fecal samples were collected for microbial RNA-Seq analysis 1 day prior to gavage of 109 CFU of a V. cholerae ΔluxS mutant, and then 2 days post-gavage (d2pg). Mean values for relative R. obeum luxS transcript levels (±SEM) are shown (n=5–6 animals/group/experiment, n=3 independent experiments; **, P<0.01 unpaired Mann-Whitney U test). (e) AI-2 levels in fecal samples taken 1 day prior to and 3 days after gavage of the V. cholerae ΔluxS from the same mice as those analyzed in panel a. AI-2 levels were measured based on induction of bioluminescence in V. harveyi BB170 using the same mass of input fecal sample for all assays. Mean values±SEM are shown; ****, P<0.0001 (unpaired Mann-Whitney U test) (f) R. obeum produces AI-2 when co-cultured with V. cholerae in vitro. Aliquots of the supernatant from cultures containing R. obeum alone, or R. obeum plus the V. cholerae ΔluxS mutant were assayed for their ability to induce V. harveyi bioluminescence. Mean values±SEM are presented (n=4 independent experiments). ****, P<0.0001 (unpaired Mann-Whitney U test). Note that (i) the number of R. obeum CFUs present in the samples obtained from mono-cultures of the organism was similar to the number in co-culture, as measured by selective plating, and (ii) the V. cholerae ΔluxS mutant cultured alone produced levels of AI-2 signal that were not significantly different from that of R. obeum in mono-culture (data not shown).
Extended Data Figure 8
Extended Data Figure 8. UPLC-MS analysis of fecal bile acid profiles in gnotobiotic mice
Targeted UPLC-MS was performed using methanol extracts of fecal pellets obtained from age-and gender-matched germ-free C57BL/6J mice and gnotobiotic mice colonized for 3 days with R. obeum alone, for 7d with the 14-member community (‘D1invasion group’), and for 3 days with the 13-member community that lacked R. obeum (n=4–6 mice/treatment group; one fecal sample analyzed/animal). (a) Fecal levels of taurocholic acid. Mean values±SEM are plotted. *, P<0.05, **, P<0.01, Mann-Whitney U test. (b) Mean relative abundance of 10 bile acid species in fecal samples obtained from the mice shown in panel (a).
Extended Data Figure 9
Extended Data Figure 9. Phylogenetic tree of luxS genes present in human gut bacterial symbionts and enteropathogens
The tree was constructed from amino acid sequence alignments using Clustal X. Red indicates that the homolog is represented in the genomes of members of the 14-member artificial human gut bacterial community.
Extended Data Figure 10
Extended Data Figure 10. In vivo tests of the effects of known quorum-sensing components on R. obeum-mediated reductions in V. cholerae colonization
(a) Competitive index of ΔluxP versus wild-type C6706 V. cholerae when colonized with or without R. obeum (n=4–6 animals/group). Horizontal bars represent mean values. Data from individual animals are show using the indicated symbols. (b) Transcript abundance (RPKM) for selected quorum sensing and virulence gene regulators in V. cholerae. Microbial RNA-Seq was performed on fecal samples collected 2 days after mono-colonization of germ-free mice with V. cholerae (circles), or 2 days after V. cholerae was introduced into mice that had been mono-colonized for 7 days with R. obeum (squares). n=5 animals/group. n.s, not significant (P≥0.05); **, P<0.01, ***, P<0.001, ****, P<0.0001 (unpaired two-tailed Student’s t-test).
Figure 1
Figure 1. R. obeum restricts V. cholerae colonization in adult gnotobiotic mice
(a) V. cholerae levels in the feces of mice colonized with the indicated human gut bacterial species (n=4–6 mice/ group). (b) Expression of R. obeum luxS AI-2 synthase in the 14-member community 4d after introduction of 109 CFU of V. cholerae or no pathogen (n=5 mice/group. Note that D. longicatena levels fall precipitously after V. cholerae invasion (Supplementary Table 9). Mean values±SEM are shown. *, P<0.05, **, P<0.01 (unpaired Mann-Whitney U test).
Figure 2
Figure 2. R. obeum AI-2 reduces V. cholerae colonization and virulence gene expression
(a) R. obeum AI-2 produced in E. coli represses the tcp promoter in V. cholerae (triplicate assays; results representative of four independent experiments). (b) Fecal V. cholerae levels in gnotobiotic mice 8h after gavage with V. cholerae and an E. coli strain containing either the PBAD-R. obeum luxS plasmid or vector control. (c) Fecal vqmA transcript abundance in mono- or co-colonized mice. (d) Competitive index of ΔvqmA versus wild-type V. cholerae during co-colonization with R. obeum (n=5 animals/group). Mean values±SEM are shown. *, P<0.05, **, P<0.01, ****, P<0.0001 (unpaired two-tailed Student’s t-test).

Comment in

References

    1. WHO. Cholera, 2011. Weekly Epidemiological Record. 2012;87:289–304. - PubMed
    1. Chowdhury F, et al. Impact of rapid urbanization on the rates of infection by Vibrio cholerae O1 and enterotoxigenic Escherichia coli in Dhaka, Bangladesh. PLoS Neglected Tropical Dis. 2011;5:e999. - PMC - PubMed
    1. Subramanian S, et al. Persistent Gut Microbiota Immaturity in Malnourished Bangladeshi Children. Nature. 2014 - PMC - PubMed
    1. Dufrene M, Legendre P. Species assemblages and indicator species: The need for a flexible asymmetrical approach. Ecol. Monographs. 1997;67:345–366.
    1. Lozupone C, Knight R. UniFrac: a new phylogenetic method for comparing microbial communities. Applied Environ. Microbiol. 2005;71:8228–8235. - PMC - PubMed

REFERENCES FOR ONLINE METHODS AND SUPPLEMENTARY INFORMATION

    1. Faiz MA, Basher A. Antimicrobial resistance: Bangladesh experience. Regional Health Forum. 2011;15:1–18.
    1. Morgan DJ, Okeke IN, Laxminarayan R, Perencevich EN, Weisenberg S. Non-prescription antimicrobial use worldwide: a systematic review. The Lancet Infectious Diseases. 2011;11:692–701. - PMC - PubMed
    1. Yatsunenko T, et al. Human gut microbiome viewed across age and geography. Nature. 2012;486:222–227. - PMC - PubMed
    1. Caporaso JG, et al. QIIME allows analysis of high-throughput community sequencing data. Nature Methods. 2010;7:335–336. - PMC - PubMed
    1. Cole JR, et al. The ribosomal database project (RDP-II): introducing myRDP space and quality controlled public data. Nucleic Acids Res. 2007;35:D169–D172. - PMC - PubMed

Publication types

MeSH terms

Substances