

Functional genomic annotation of genetic risk loci highlights inflammation and epithelial biology networks in CKD
- PMID: 25231882
- PMCID: PMC4341476
- DOI: 10.1681/ASN.2014010028
Functional genomic annotation of genetic risk loci highlights inflammation and epithelial biology networks in CKD
Abstract
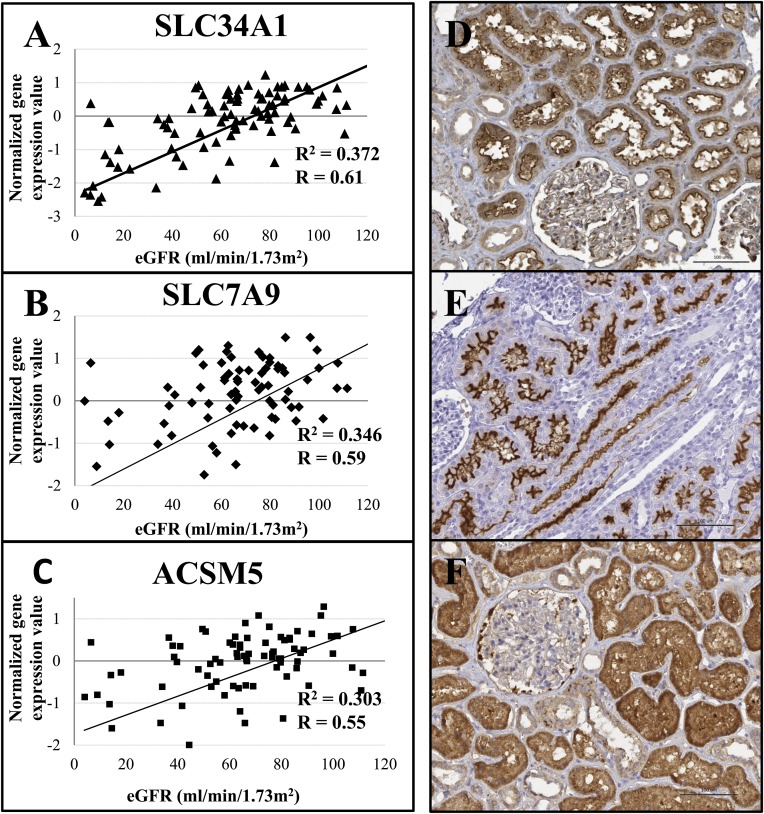
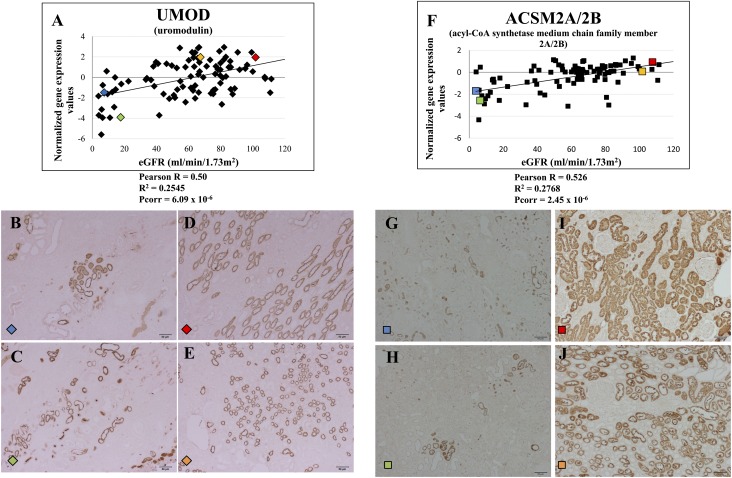
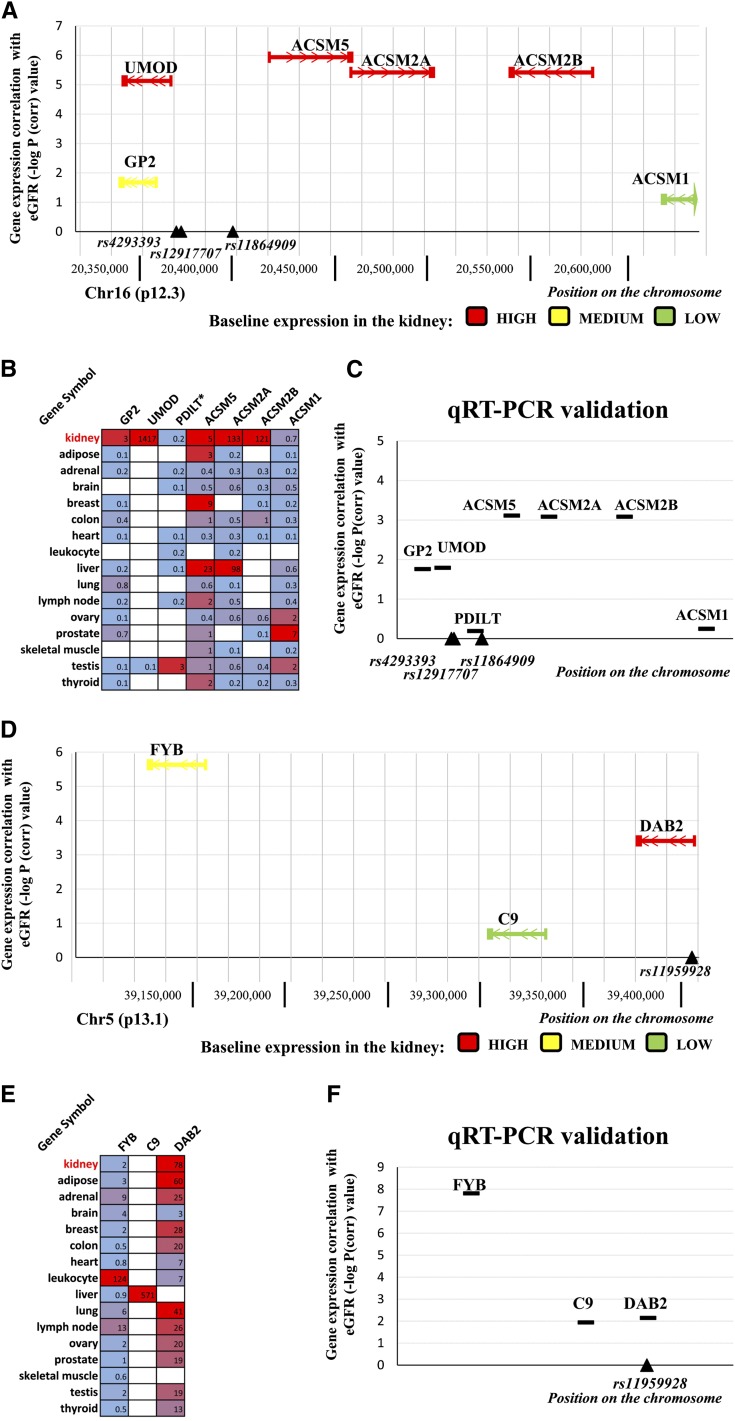
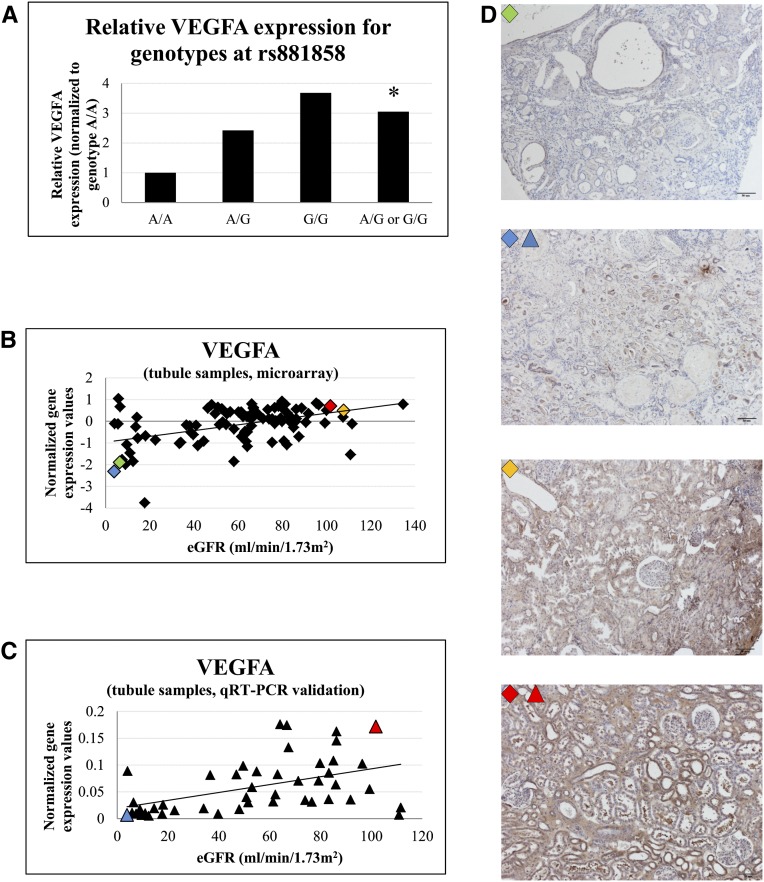
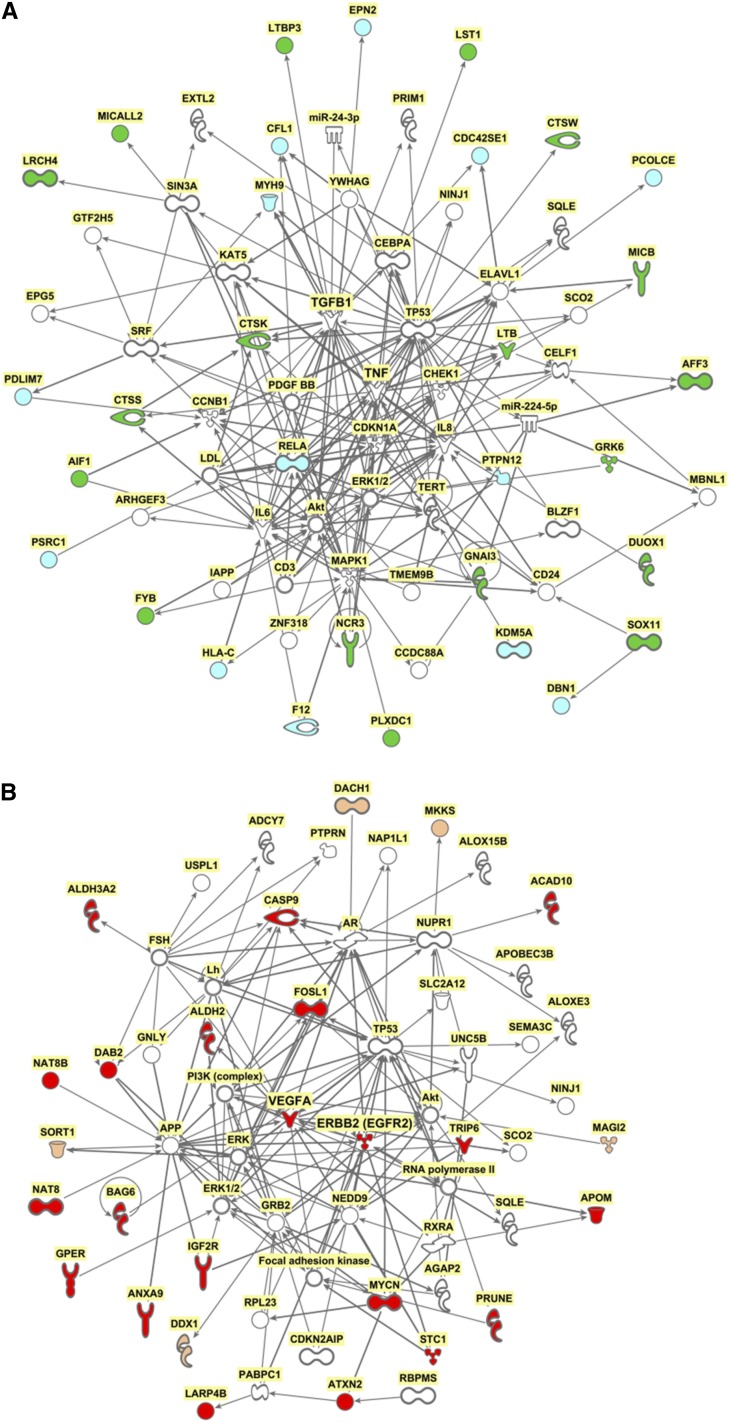
Genome-wide association studies (GWASs) have identified multiple loci associated with the risk of CKD. Almost all risk variants are localized to the noncoding region of the genome; therefore, the role of these variants in CKD development is largely unknown. We hypothesized that polymorphisms alter transcription factor binding, thereby influencing the expression of nearby genes. Here, we examined the regulation of transcripts in the vicinity of CKD-associated polymorphisms in control and diseased human kidney samples and used systems biology approaches to identify potentially causal genes for prioritization. We interrogated the expression and regulation of 226 transcripts in the vicinity of 44 single nucleotide polymorphisms using RNA sequencing and gene expression arrays from 95 microdissected control and diseased tubule samples and 51 glomerular samples. Gene expression analysis from 41 tubule samples served for external validation. 92 transcripts in the tubule compartment and 34 transcripts in glomeruli showed statistically significant correlation with eGFR. Many novel genes, including ACSM2A/2B, FAM47E, and PLXDC1, were identified. We observed that the expression of multiple genes in the vicinity of any single CKD risk allele correlated with renal function, potentially indicating that genetic variants influence multiple transcripts. Network analysis of GFR-correlating transcripts highlighted two major clusters; a positive correlation with epithelial and vascular functions and an inverse correlation with inflammatory gene cluster. In summary, our functional genomics analysis highlighted novel genes and critical pathways associated with kidney function for future analysis.
Keywords: CKD; gene expression; genetics of complex trait.
Copyright © 2015 by the American Society of Nephrology.
Figures


Similar articles
-
Renal compartment-specific genetic variation analyses identify new pathways in chronic kidney disease.Nat Med. 2018 Nov;24(11):1721-1731. doi: 10.1038/s41591-018-0194-4. Epub 2018 Oct 1. Nat Med. 2018. PMID: 30275566 Free PMC article.
-
Genetic-Variation-Driven Gene-Expression Changes Highlight Genes with Important Functions for Kidney Disease.Am J Hum Genet. 2017 Jun 1;100(6):940-953. doi: 10.1016/j.ajhg.2017.05.004. Am J Hum Genet. 2017. PMID: 28575649 Free PMC article.
-
Integrative biology identifies shared transcriptional networks in CKD.J Am Soc Nephrol. 2014 Nov;25(11):2559-72. doi: 10.1681/ASN.2013080906. Epub 2014 Jun 12. J Am Soc Nephrol. 2014. PMID: 24925724 Free PMC article.
-
The UMOD Locus: Insights into the Pathogenesis and Prognosis of Kidney Disease.J Am Soc Nephrol. 2018 Mar;29(3):713-726. doi: 10.1681/ASN.2017070716. Epub 2017 Nov 27. J Am Soc Nephrol. 2018. PMID: 29180396 Free PMC article. Review.
-
Complexities of Understanding Function from CKD-Associated DNA Variants.Clin J Am Soc Nephrol. 2020 Jul 1;15(7):1028-1040. doi: 10.2215/CJN.15771219. Epub 2020 Jun 8. Clin J Am Soc Nephrol. 2020. PMID: 32513823 Free PMC article. Review.
Cited by
-
It Takes Two to Tango: The Role of Dysregulated Metabolism and Inflammation in Kidney Disease Development.Semin Nephrol. 2020 Mar;40(2):199-205. doi: 10.1016/j.semnephrol.2020.01.010. Semin Nephrol. 2020. PMID: 32303282 Free PMC article. Review.
-
Plasma Biomarkers and Kidney Function Decline in Early and Established Diabetic Kidney Disease.J Am Soc Nephrol. 2017 Sep;28(9):2786-2793. doi: 10.1681/ASN.2016101101. Epub 2017 May 5. J Am Soc Nephrol. 2017. PMID: 28476763 Free PMC article.
-
Expression of Acsm2, a kidney-specific gene, parallels the function and maturation of proximal tubular cells.Am J Physiol Renal Physiol. 2020 Oct 1;319(4):F603-F611. doi: 10.1152/ajprenal.00348.2020. Epub 2020 Aug 24. Am J Physiol Renal Physiol. 2020. PMID: 32830538 Free PMC article.
-
Translational nephrology: what translational research is and a bird's-eye view on translational research in nephrology.Clin Kidney J. 2015 Feb;8(1):14-22. doi: 10.1093/ckj/sfu142. Epub 2015 Jan 28. Clin Kidney J. 2015. PMID: 25713705 Free PMC article.
-
Uromodulin (Tamm-Horsfall protein): guardian of urinary and systemic homeostasis.Nephrol Dial Transplant. 2020 Jan 1;35(1):33-43. doi: 10.1093/ndt/gfy394. Nephrol Dial Transplant. 2020. PMID: 30649494 Free PMC article. Review.
References
-
- Go AS, Chertow GM, Fan D, McCulloch CE, Hsu CY: Chronic kidney disease and the risks of death, cardiovascular events, and hospitalization. N Engl J Med 351: 1296–1305, 2004 - PubMed
-
- Böger CA, Heid IM: Chronic kidney disease: Novel insights from genome-wide association studies. Kidney Blood Press Res 34: 225–234, 2011 - PubMed
-
- Maurano MT, Humbert R, Rynes E, Thurman RE, Haugen E, Wang H, Reynolds AP, Sandstrom R, Qu H, Brody J, Shafer A, Neri F, Lee K, Kutyavin T, Stehling-Sun S, Johnson AK, Canfield TK, Giste E, Diegel M, Bates D, Hansen RS, Neph S, Sabo PJ, Heimfeld S, Raubitschek A, Ziegler S, Cotsapas C, Sotoodehnia N, Glass I, Sunyaev SR, Kaul R, Stamatoyannopoulos JA: Systematic localization of common disease-associated variation in regulatory DNA. Science 337: 1190–1195, 2012 - PMC - PubMed
Publication types
MeSH terms
Substances
Grants and funding
LinkOut - more resources
Full Text Sources
Other Literature Sources
Medical
Molecular Biology Databases
Research Materials
Miscellaneous
