Comparative Study
. 2014 Nov 5;25(22):3610-8.
doi: 10.1091/mbc.E14-06-1091. Epub 2014 Sep 17.

Comparative assessment of fluorescent transgene methods for quantitative imaging in human cells

Affiliations
Comparative Study

Comparative assessment of fluorescent transgene methods for quantitative imaging in human cells

Robert Mahen et al. Mol Biol Cell. .

Abstract

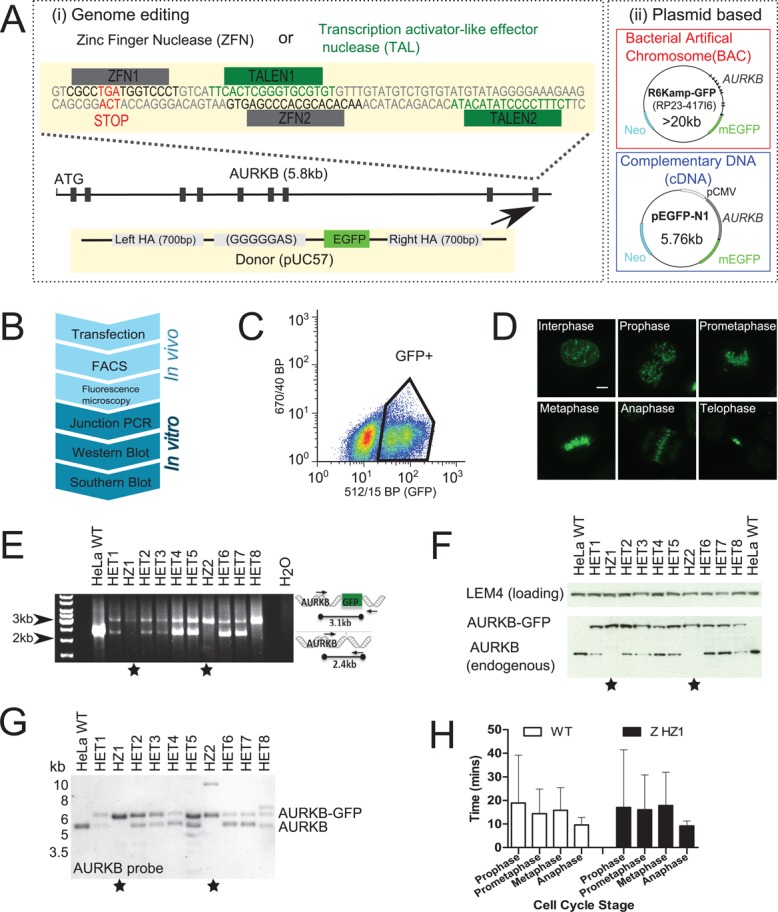
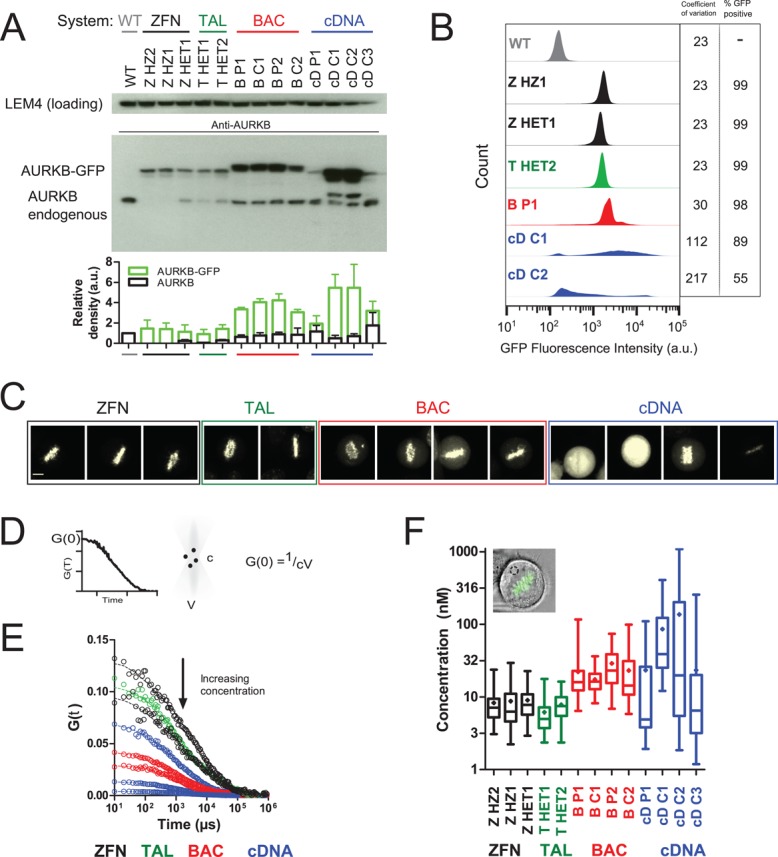
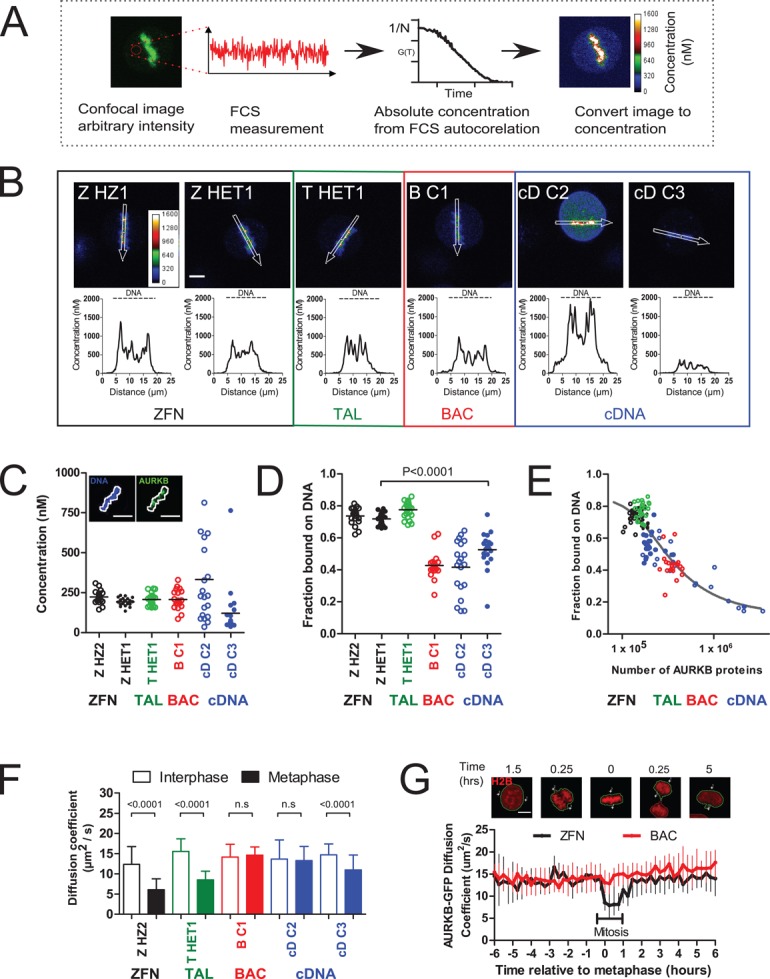
Fluorescence tagging of proteins is a widely used tool to study protein function and dynamics in live cells. However, the extent to which different mammalian transgene methods faithfully report on the properties of endogenous proteins has not been studied comparatively. Here we use quantitative live-cell imaging and single-molecule spectroscopy to analyze how different transgene systems affect imaging of the functional properties of the mitotic kinase Aurora B. We show that the transgene method fundamentally influences level and variability of expression and can severely compromise the ability to report on endogenous binding and localization parameters, providing a guide for quantitative imaging studies in mammalian cells.


Figures

FIGURE 1:
FIGURE 1:
Construction and validation of genome-edited cell lines expressing AURKB-GFP. (A) Schematic of fluorescent gene–tagging systems used to create AURKB-GFP. (i) ZFNs or TALENs cause DNA double-strand breaks at the C-terminus of the AURKB locus, before repair with a donor construct containing EGFP (arrow). (ii) Plasmids containing AURKB-GFP as either the full mouse gene (BAC) or as cDNA are randomly integrated into the genome. (B) Flowchart of assays used to construct genome-edited cell lines. Junction PCR was not used to screen plasmid-based systems since the genomic locations are unknown. (C) Fluorescence-activated cell sorting of GFP-positive cells. Gates were drawn based on comparison to nonfluorescent wild-type parental cells. (D) Fluorescence confocal microscopy maximum-intensity z-projections of genome-edited AURKB-GFP cells (clone HZ2). (E) Junction PCR screening of ZFN genome-edited AURKB-GFP clonal cells. Stars denote clones with all alleles successfully targeted. (F) Western blot screening of nocodazole-arrested ZFN AURKB-GFP cells with anti-AURKB antibody. (G) Southern blot screening of ZFN AURKB-GFP cells using a probe in AURKB intron 2 after Kpnl and Nsil digestion. (H) Mitotic timing from live-cell imaging; cells were automatically classified into cell cycle stages using mCherry-H2B as previously described (Held et al., 2010). n >355 cells from two experiments.
FIGURE 2:
FIGURE 2:
Expression system determines AURKB-GFP levels. (A) Western blot comparison of AURKB levels in nocodazole-arrested cells. BAC-expressed AURKB-GFP runs at a higher molecular weight due to the presence of an S-peptide in addition to the EGFP tag. The graph shows the mean ± SD of three independent experiments. (B) Flow cytometry analysis of AURKB-GFP intensity in nocodazole-arrested cells. Coefficient of variation is from the whole population. GFP+ was defined as 3 SD above autofluorescence from wild-type cells. (C) Sum intensity confocal images of AURKB-GFP using the same imaging conditions throughout. One metaphase cell is shown per panel. Left to right: ZHZ2, ZHZ1, ZHET1, THET1, THET2, BP1, BC1, BP2, BC2, cDP1, cDC1, cDC2, and cDC3. Scale bar, 7 μm. (D) The amplitude of the FCS autocorrelation function (see Materials and Methods), G(0), is inversely proportional to particle number. Absolute protein concentration, c, is calculated using the measured confocal volume, V. (E) AURKB-GFP FCS autocorrelation curves from single representative cells. Top to bottom: ZHZ2, THET1, ZHET1, cDC3, BP2, BC2, cDC2, and cDC1. (F) AURKB-GFP cytoplasmic concentration calculated by fitting FCS autocorrelation curves with a one-component anomalous model of diffusion as described in Materials and Methods. The box and whiskers plot is from >23 cells/sample from two experiments. The mean is depicted as a diamond and the median as a horizontal line, and the whiskers show the minimum and maximum.
FIGURE 3:
FIGURE 3:
Overexpression alters AURKB-GFP biophysical properties on chromatin and in the cytosol. (A) Schematic of FCS-calibrated imaging. Concentration is determined in one location using FCS, and then an image is taken of the same cell. The image is converted to absolute concentrations using the FCS calibration. (B) Absolute concentration maps of AURKB-GFP in metaphase cells. The line profiles were taken in the areas depicted by the white arrows in the image directly above. Scale bar, 7 μm. (C) AURKB-GFP concentration on the metaphase plate. DNA was automatically identified based on a threshold of Hoechst staining of DNA (white line). Scale bar, 10 μm. (D) Fraction of AURKB-GFP proteins bound on chromatin. Horizontal bar shows the mean. (E) Fraction of chromatin bound AURKB-GFP (dots) as a function of the total number of AURKB proteins. The line is the equilibrium solution of a mass action model of reversible AURKB chromatin binding (see Materials and Methods; total number of chromatin-binding sites CT = 147,000, Kd = 5.21 nM). (F) AURKB-GFP diffusion coefficient from FCS data of >56 cells/sample from four experiments. (G) Single-cell-tracking automated FCS and time-lapse microscopy of AURKB-GFP diffusional mobility through the cell cycle as described in Materials and Methods. Plotted are the median and interquartile range from 9–45 cells. Scale bar, 10 μm. Significance testing by Mann–Whitney test.

References

    1. Bibikova M, Beumer K, Trautman JK, Carroll D. Enhancing gene targeting with designed zinc finger nucleases. Science. 2003;300:764. - PubMed
    1. Boshart M, Weber F, Jahn G, Dorsch-Häsler K, Fleckenstein B, Schaffner W. A very strong enhancer is located upstream of an immediate early gene of human cytomegalovirus. Cell. 1985;41:521–530. - PubMed
    1. Burgess A, Lorca T, Castro A. Quantitative live imaging of endogenous DNA replication in mammalian cells. PLoS One. 2012;7:e45726. - PMC - PubMed
    1. Carmena M, Wheelock M, Funabiki H, Earnshaw WC. The chromosomal passenger complex (CPC): from easy rider to the godfather of mitosis. Nat Rev Mol Cell Biol. 2012;13:789–803. - PMC - PubMed
    1. Doyon JB, Zeitler B, Cheng J, Cheng AT, Cherone JM, Santiago Y, Lee AH, Vo TD, Doyon Y, Miller JC, et al. Rapid and efficient clathrin-mediated endocytosis revealed in genome-edited mammalian cells. Nat Cell Biol. 2011;13:331–337. - PMC - PubMed

Publication types

LinkOut - more resources