. 2014 Nov 5;25(22):3595-609.
doi: 10.1091/mbc.E14-07-1240. Epub 2014 Sep 17.

Dynamin recruitment and membrane scission at the neck of a clathrin-coated pit

Affiliations

Dynamin recruitment and membrane scission at the neck of a clathrin-coated pit

Emanuele Cocucci et al. Mol Biol Cell. .

Abstract

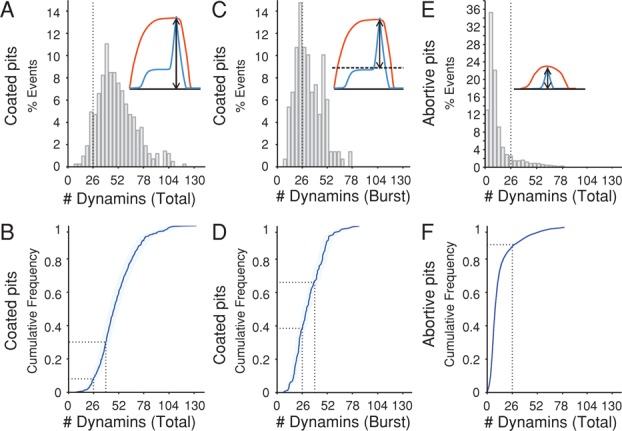
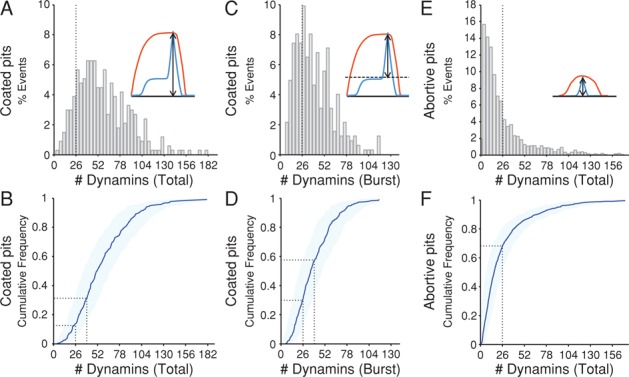
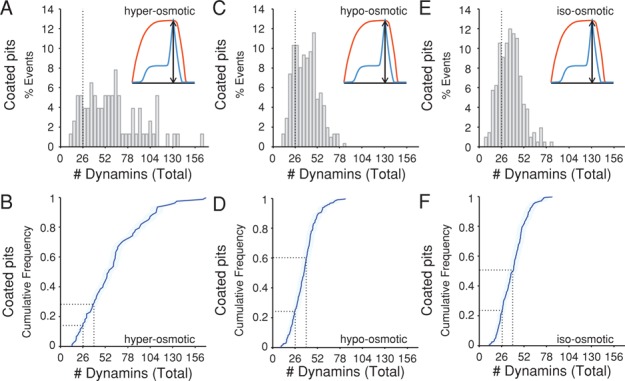
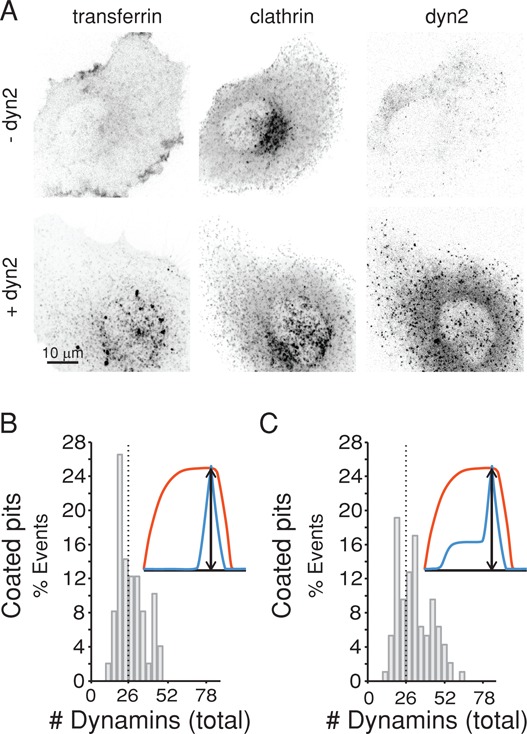
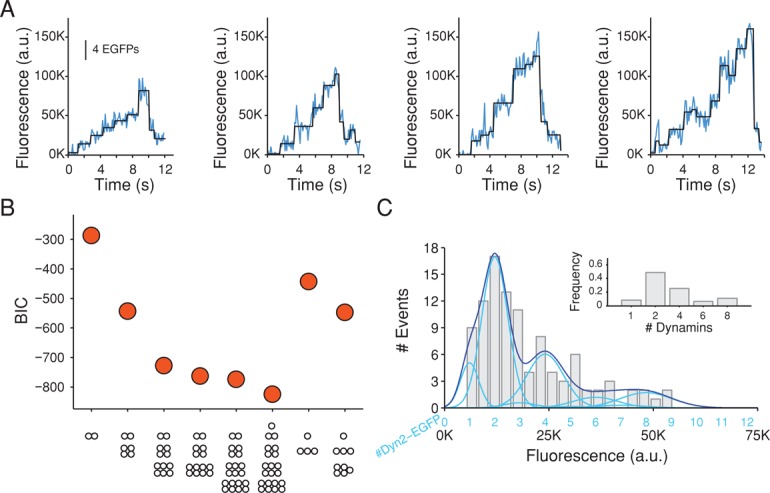
Dynamin, the GTPase required for clathrin-mediated endocytosis, is recruited to clathrin-coated pits in two sequential phases. The first is associated with coated pit maturation; the second, with fission of the membrane neck of a coated pit. Using gene-edited cells that express dynamin2-EGFP instead of dynamin2 and live-cell TIRF imaging with single-molecule EGFP sensitivity and high temporal resolution, we detected the arrival of dynamin at coated pits and defined dynamin dimers as the preferred assembly unit. We also used live-cell spinning-disk confocal microscopy calibrated by single-molecule EGFP detection to determine the number of dynamins recruited to the coated pits. A large fraction of budding coated pits recruit between 26 and 40 dynamins (between 1 and 1.5 helical turns of a dynamin collar) during the recruitment phase associated with neck fission; 26 are enough for coated vesicle release in cells partially depleted of dynamin by RNA interference. We discuss how these results restrict models for the mechanism of dynamin-mediated membrane scission.


Figures

FIGURE 1:
FIGURE 1:
Rigid-body fit of the x-ray crystallographic atomic model of dynamin to the density from the cryo-EM image reconstruction. (A) Side view from outside the right-handed, single-start helix. Gray, contours of the cryo-EM map (EMD-1949; Chappie et al., 2011). The ribbon diagram shows an X-shaped dynamin dimer, with the GTPase domains projecting away from the midplane of the X and with the PRD at the carboxy-terminus removed (PDB 3ZVR; Ford et al., 2011). The PH domains are flexibly tethered at the other end of each dynamin stalk. The dynamin atomic model was inserted into the dynamin helix cryo-EM density map using Chimera (Goddard et al., 2007), with Figure 5 in Chappie et al. (2011) as a guide. (B) End view of the same to show the relation between the inner membrane bilayer and dynamin.
FIGURE 2:
FIGURE 2:
Gene editing of SUM cells to express dynamin2-EGFP. (A) Schematic representation of the gene-editing strategy used with SUM159 cells to incorporate EGFP to the C-terminus of dynamin2 based on the TALEN approach (Sanjana et al., 2012). The portions of the genomic DNA highlighted in red correspond to the sequences recognized by the DNA-binding domains constructed and then fused to two different copies of the Fok1 endonuclease; the stop codon TAG indicates the site of EGFP incorporation. The resulting sequence joined by a short linker between the C-terminus of dynamin2 and N-terminus of EGFP is indicated. (B) PCR analysis showing the biallelic integration of EGFP into the dynamin2 locus in the clonal cell line SUM-Dyn2; SUM denotes the parental cells. (C) Western blot analysis of cell lysates from brain or from SUM-Dyn2 cells expressing dynamin2-EGFP probed with antibodies specific for dynamin1 or dynamin2. Quantification of band intensities indicates that in SUM-Dyn2, ∼2% of expressed dynamin2 lacks EGFP (98% substitution) and ∼5% of dynamin1 in the total pool of dynamin1, dynamin2, and dynamin2-EGFP. Similar results were obtained with a different Western blot from a second cell lysate (unpublished data). (D) Expression of dynamin2-EGFP does not affect the receptor-mediated endocytosis of transferrin. The endocytosis of fluorescently tagged Alexa 647 transferrin was determined using a flow cytometry–based assay. Cells were first incubated with Alexa 647–transferrin for 10 min at 4°C or 10 min at 37°C and then subjected to an acid wash in ice-cold medium to remove the transferrin bound to the cell surface. The histogram shows the same amount of transferrin internalized by the parental SUM and gene-edited SUM-Dyn2 cells. The bars represent the average ± SD from duplicate determinations carried out using ∼10,000 cells/measurement. (E) Frame from a time series of coated pits from the attached surface of SUM-Dyn2 cell expressing dynamin2-EGFP (green) and clathrin mCherry-LCa (red). Consecutive images for each fluorescence channel were obtained with 30-ms exposure using spinning-disk fluorescence confocal microscopy. Channels were shifted vertically by 4 pixels to help identify pits containing both fluorescently tagged proteins. Scale bar, 5 μm.
FIGURE 3:
FIGURE 3:
Characterization of hCLTAEN/DNM2EN cells expressing dynamin2-EGFP. (A) PCR analysis confirms published results (Doyon et al., 2011) showing the biallelic integration of EGFP to the dynamin2 in the clonal cell line named hCLTAEN/DNM2EN gene-edited to express dynamin2-EGFP and LCa-RFP; SK-MEL-2 denotes the parental cell line. (B) Western blot analysis of cell lysates from brain or from hCLTAEN/DNM2EN cells expressing dynamin2-EGFP probed with antibodies specific for dynamin1 or dynamin2. Quantification of band intensities indicates that ∼50% of expressed dynamin2 lacks EGFP and that dynamin1 is undetectable in the total pool of dynamin of hCLTAEN/DNM2EN cells. Similar results were obtained using another cell lysate obtained from the hCLTAEN/DNM2EN cells (unpublished data). (C) Frame from a time series showing fluorescent spots corresponding to coated pits labeled with dynamin2-EGFP (green) and clathrin LCa-RFP. The image was acquired using spinning-disk confocal microscopy from the attached surface of hCLTAEN/DNM2EN cells. Consecutive images for each fluorescence channel were obtained with 30-ms exposure. Channels shifted vertically by four pixels. Scale bar, 5 μm.
FIGURE 4:
FIGURE 4:
Representative traces of clathrin-coated pits forming in SUM-Dyn2 cells. Plot of the fluorescence intensity traces of dynamin2-EGFP (blue) and mCherry-LCa (red) from SUM-Dyn2 cells recruited during formation of clathrin-coated pits in Sum-Dyn2 cells. The data are from 5-min time series obtained using spinning-disk confocal microscopy every 1 s with an exposure of 30 ms/frame. The traces highlight examples of the variability in the recruitment patterns during the first and second phases of association with clathrin-coated pits. (A) Relatively small amount of dynamin recruited during the first phase, followed by a brief but pronounced sharp recruitment during the second phase. (B) A significant amount of dynamin recruited during the first phase, followed by a distinctive recruitment burst during the second phase. (C) A significant amount of dynamin recruited during the first phase that is poorly resolved from the recruitment preceding membrane scission. (D) Dynamin is recruited as a relatively broad burst toward the end of the budding process.
FIGURE 5:
FIGURE 5:
Number of dynamin molecules recruited to coated pits at the time of membrane fission in SUM-Dyn2 cells. The number of dynamin molecules recruited to clathrin-coated structures was obtained from the net fluorescence intensities of recruited dynamin2-EGFP (fluorescence intensity for a given spot minus the fluorescence intensity of the background calibrated by the fluorescence of a single molecule), corrected for the calculated substitution (98%) of endogenous dynamin2 by dynamin2-EGFP. Data from five cells, obtained using spinning-disk confocal microscopy; the time series acquired every 1 s with an exposure of 30 ms/frame. (A) Histogram of the total number of dynamin molecules recruited to coated pits at the time of membrane fission (426 pits). Dotted line marks 26 dynamins. (B) Cumulative distribution associated with the values shown in A demonstrating that ∼25% of the coated pits recruited between 26 and 40 dynamin molecules and 28% recruit between 40 and 52. Dotted lines mark 26 and 40 dynamins. The light blue area overlapping the tracings indicates 95% confidence interval for the estimated number of recruited dynamins. (C) Histogram of the number of dynamins recruited during the final burst (150 pits) shows that it peaks at ∼26 dynamins. The number of recruited molecules was calculated as the difference between the maximal peak value and the value averaged from frames imaged 9, 10, and 11 s before the peak. (D) Cumulative distribution of the data in C; ∼30% of the pits recruited between 26 and 40 dynamins and 23% between 40 and 52. Dotted lines mark 26 and 40 dynamins. (E) Histogram of the maximum number of dynamin molecules recruited to abortive pits (n = 8514). Dotted line marks 26 dynamins. (F) Cumulative distribution of the data in E; ∼90% of the pits recruited <26 dynamin molecules. Dotted line marks 26 dynamins.
FIGURE 6:
FIGURE 6:
Number of dynamin molecules recruited to coated pits at the time of membrane fission in hCLTAEN/DNM2EN cells. The number of dynamin molecules recruited to clathrin-coated structures was obtained as described in Figure 5 from three cells. The substitution of endogenous dynamin2 by dynamin2-EGFP in hCLTAEN/DNM2EN cells was ∼50%. (A) Histogram of the total number of dynamin molecules recruited to coated pits at the time of membrane fission (337 pits). (B) Cumulative distribution of the data in A; ∼19% of the coated pits recruited between 26 and 40 dynamin molecules, and ∼23% recruited between 40 and 52 dynamins. (C) Histogram of the number of dynamins recruited during the final burst (337 pits) shows a peak at ∼26 dynamins. Dotted line marks 26 dynamins. (D) Cumulative distribution of the data in C; ∼27% of the pits recruited between 26 and 40 dynamins, and ∼24% recruited between 26 and 40. Dotted lines mark 26 and 40 dynamins. (E) Histogram of the maximum number of dynamin molecules recruited to abortive pits (n = 1523). Dotted line marks 26 dynamins. (F) Cumulative distribution of the shown in E; ∼70% of the pits recruited <26 dynamin molecules. Dotted line marks 26 dynamins.
FIGURE 7:
FIGURE 7:
Effect of membrane tension on the number of dynamin molecules recruited to coated pits at the time of membrane fission. The total number of dynamin molecules recruited to clathrin-coated pits was determined as in Figure 5 using Sum-Dyn2 briefly exposed for 10 min to media of different osmolarities. Five cells were used per condition. (A) Histogram of the total number of dynamin molecules recruited to coated pits of cells incubated in hyper-osmotic medium at the time of membrane fission (78 pits). (B) Cumulative distribution of the data in A; ∼16% of the pits recruit between 26 and 40 dynamins, and 13% recruited between 40 and 52 dynamins. (C) Histogram of the total number of dynamin molecules recruited to coated pits of cells incubated in hypo-osmotic medium at the time of membrane fission (210 pits). (D) Cumulative distribution of the data in C; ∼38% of the pits recruit between 26 and 40 dynamins, and ∼27% recruited between 40 and 52 dynamins. (E) Histogram of the total number of dynamin molecules recruited to coated pits of cells incubated in iso-osmotic medium at the time of membrane fission (312 pits). (F) Cumulative distribution of the data in E; ∼30% of the pits recruited between 26 and 40 dynamins, and ∼30% recruited between 40 and 52 dynamins.
FIGURE 8:
FIGURE 8:
Effect of dynamin depletion on the amount of dynamin recruited to coated pits at the time of membrane fission. SUM-Dyn2 expressing mCherry-LCa was depleted of dynamin2 by RNAi treatment for 5 d and then analyzed for the effects on transferrin uptake and on the number of dynamin molecules recruited to the few coated pits that still formed. (A) Representative z-stack projections of planes spaced at 350 nm acquired by live-cell three-dimensional spinning-disk confocal fluorescence microscopy of fluorescently tagged transferrin-A647, mCherry-LCa (clathrin), and dynamin2-EGFP, comparing cells depleted of dynamin2 (−dyn2) with controls (+dyn2); just before imaging, the cells were exposed to 50 μg/ml transferrin-A647 for 7 min at 37°C. The images of the dynamin-depleted cells illustrate absence of the intracellular punctuate pattern characteristic of endocytosed transferrin-A647 and decrease in the overall fluorescence signal of dynamin2-EGFP. (B) Total number of dynamin molecules recruited at the time of membrane fission determined as in Figure 5 from 10 Sum-Dyn2 cells depleted of dynamin2 and unable to internalize transferrin-A647. Histogram is for data from 50 clathrin-coated pits that lacked the first recruitment phase. Dotted line marks 26 dynamins. (C) Histogram is for all the coated pits identified in the 10 cells with and without the first recruitment phase (97 pits). Dotted line marks 26 dynamins.
FIGURE 9:
FIGURE 9:
Stepwise recruitment of dynamin during the formation of coated pits detected with single-molecule sensitivity. (A) Representative plots of fluorescence intensity traces of dynamin2-EGFP recruited to four assembling coated pits in SUM-dyn2 cells imaged with TIRF microscopy every 110 ms with an exposure of 60 ms/frame; fit (black) obtained by applying a step-fitting function to estimate the average fluorescence intensity and dwell time of the steps. (B) Value of the BIC used to determine the best fit between the experimental data from 104 recruitment steps from 23 coated pits in five cells and the stepwise recruitment models of dynamin indicated at the bottom. The quality of the fit increases with more-negative BIC values. The dynamin2 substitution by dynamin2-EGFP was kept as a fixed parameter corresponding to the value estimated by Western blot analysis (98%). The best fit corresponds to a recruitment model of 8% monomers, 49% dimers, 26% tetramers, 6% hexamers, and 11% octamers. (C) Histogram of the background-corrected fluorescence intensity of the steps (gray) used to calculate the data in B; the continuous trace (dark blue) is the sum of the relative contributions calculated by the presence of one, two, three, four, and so on dynamin2-EGFP molecules (light blue; centered at 6050 ± 2200, 12,100 ± 4400, 18,150 ± 6600, 24,200 ± 8800, etc.) according to the best model presented in B. Inset, preferential recruitment of dynamin2 dimers (49%) and the less frequent recruitment of dynamin2 monomers (8%), tetramers (26%), hexamers (6%), and octamers (11%).
FIGURE 10:
FIGURE 10:
Proposed models for dynamin-mediated scission. (A) Isotropic contraction model requiring close to two turns of the basic helix. Consecutive cycles of GTPase activation between domains phasing opposing rungs provide the power stroke that ultimately compresses the spiral to reach conditions of membrane hemifission and eventual membrane scission. (Adapted from Faelber et al., 2011.) (B) Circumferential twist model proposed in this study, in which two dimers at the leading edge of a dynamin rung interact through their opposing GTPase domains (yellow). Activation of the GTPase activity induces a local conformational change—in effect, a power stroke that locally tightens the approaching ends of the assembled rung. To this effect, arrival of a dynamin dimer (green) to one of the rung ends (yellow) results in the GTPase activation and conformational change of the opposing domains (green and red) associated with the next power stroke. A limited number of such sequential additions would be sufficient to tighten the rung, eventually leading to membrane hemifission and membrane scission.

Similar articles

Cited by

References

    1. Aguet F, Antonescu CN, Mettlen M, Schmid SL, Danuser G. Advances in analysis of low signal-to-noise images link dynamin and AP2 to the functions of an endocytic checkpoint. Dev Cell. 2013;26:279–291. - PMC - PubMed
    1. Bashkirov PV, Akimov SA, Evseev AI, Schmid SL, Zimmerberg J, Frolov VA. GTPase cycle of dynamin is coupled to membrane squeeze and release, leading to spontaneous fission. Cell. 2008;135:1276–1286. - PMC - PubMed
    1. Binns DD, Barylko B, Grichine N, Atkinson MA, Helms MK, Jameson DM, Eccleston JF, Albanesi JP. Correlation between self-association modes and GTPase activation of dynamin. J Protein Chem. 1999;18:277–290. - PubMed
    1. Böcking T, Aguet F, Harrison SC, Kirchhausen T. Single-molecule analysis of a molecular disassemblase reveals the mechanism of Hsc70-driven clathrin uncoating. Nat Struct Mol Biol. 2011;18:295–301. - PMC - PubMed
    1. Boll W, Ohno H, Songyang Z, Rapoport I, Cantley LC, Bonifacino JS, Kirchhausen T. Sequence requirements for the recognition of tyrosine-based endocytic signals by clathrin AP-2 complexes. EMBO J. 1996;15:5789–5795. - PMC - PubMed

Publication types

MeSH terms

LinkOut - more resources